Workshop
RAWGraphs workshop at Visualized Milan
March 16th, 2017, by RAW Graphs Team

After Berlin and London, the third European Visualized chapter came to Milan last week-end for an inspiring and educational one-day conference.
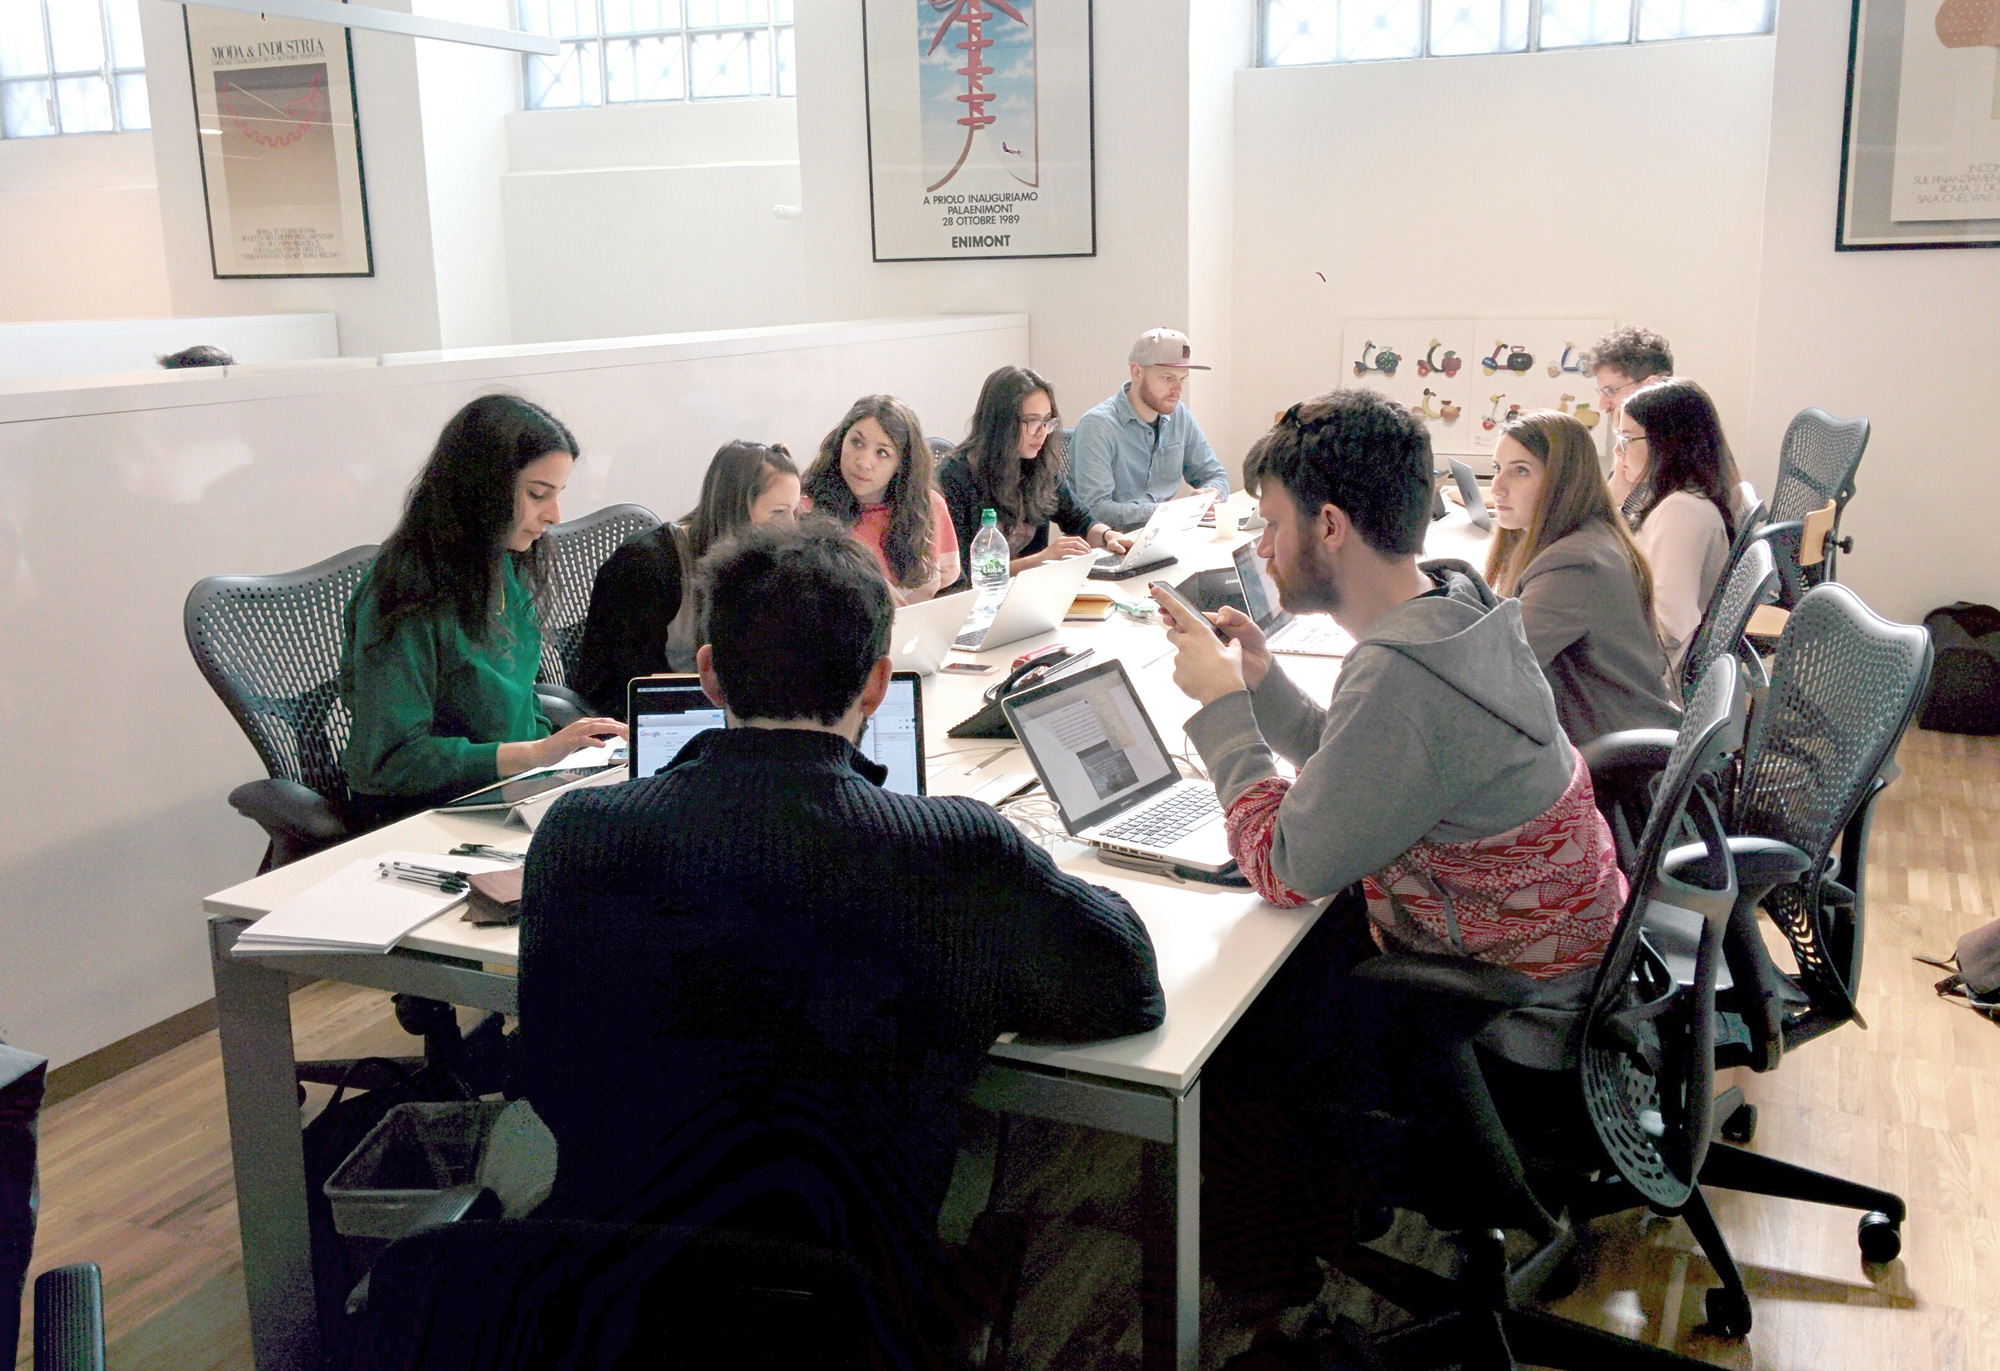
We have been invited by the Visualized team to organize an intensive one day workshop the day before the conference to teach how to use RAWGraphs to a group of 20 participants. The goal of the workshop was to understand the basic features of the tool and create in one day a responsive visualization using ai2html, a very cool open-source script for Adobe Illustrator that converts your Illustrator documents into html and css done by Archie Tse, deputy graphics editor at The New York Times.
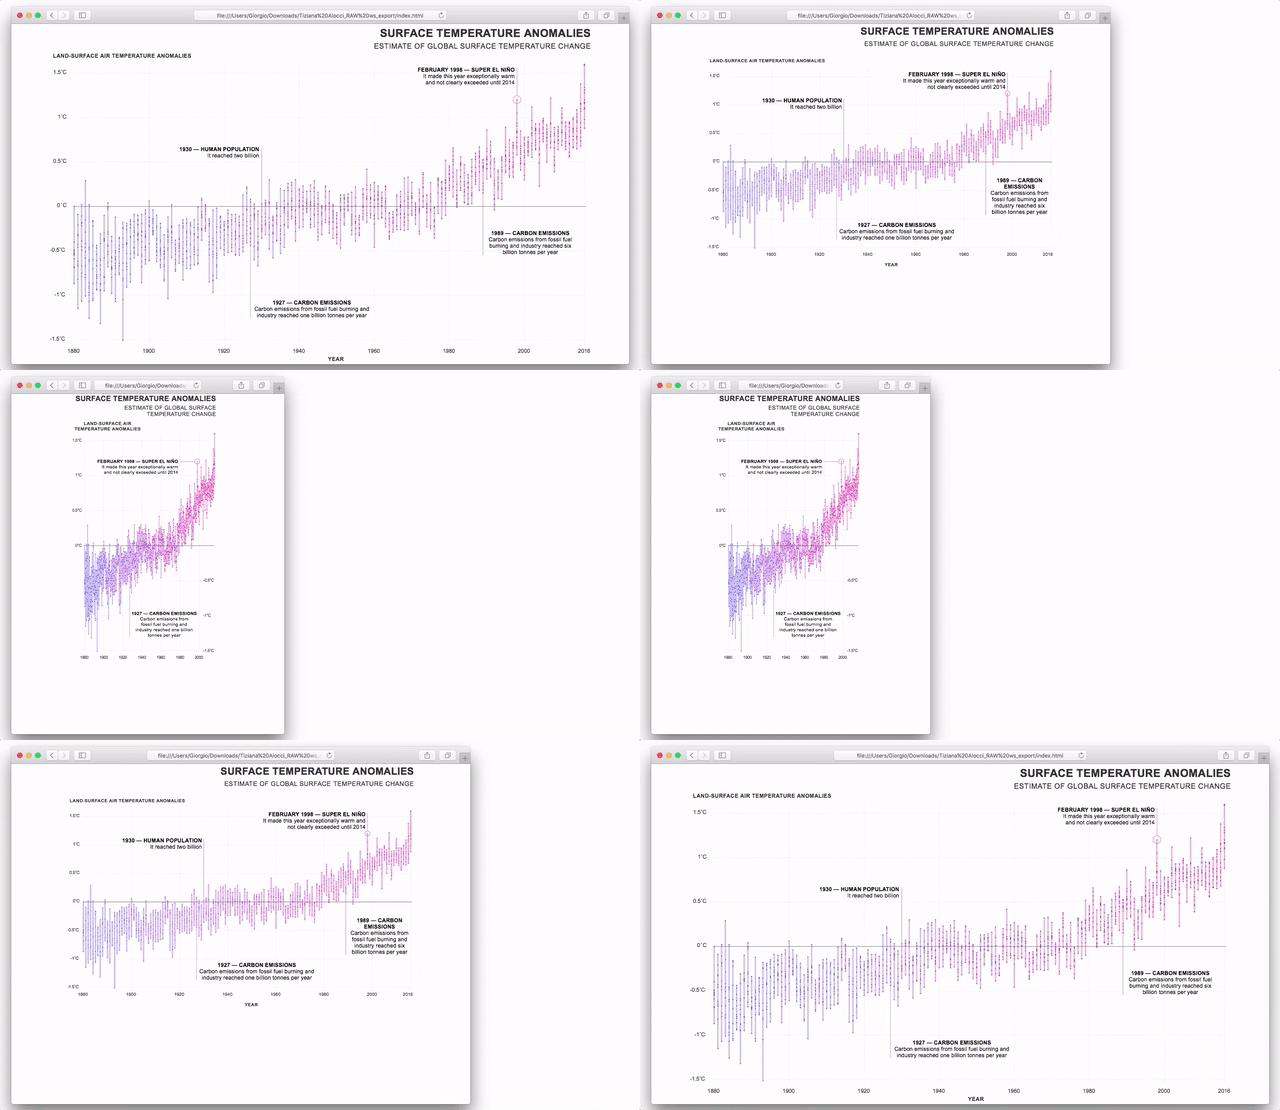
The participants explored different open datasets and decided how to design a visualization for 3 different breakpoints (desktop, tablet and smartphone).Here you can see an example of a responsive visualization done during the workshop.

Work done by Tiziana Alocci. See it live at this link (remember to resize the window).
If you are interested in organizing a workshop about RAWGraphs feel free to contact us at hello@rawgraphs.io. They are important moments for us to understand how people use the tool and understand how to improve the project.
Thanks again to Inarea for hosting the workshop in their Milan offices.
