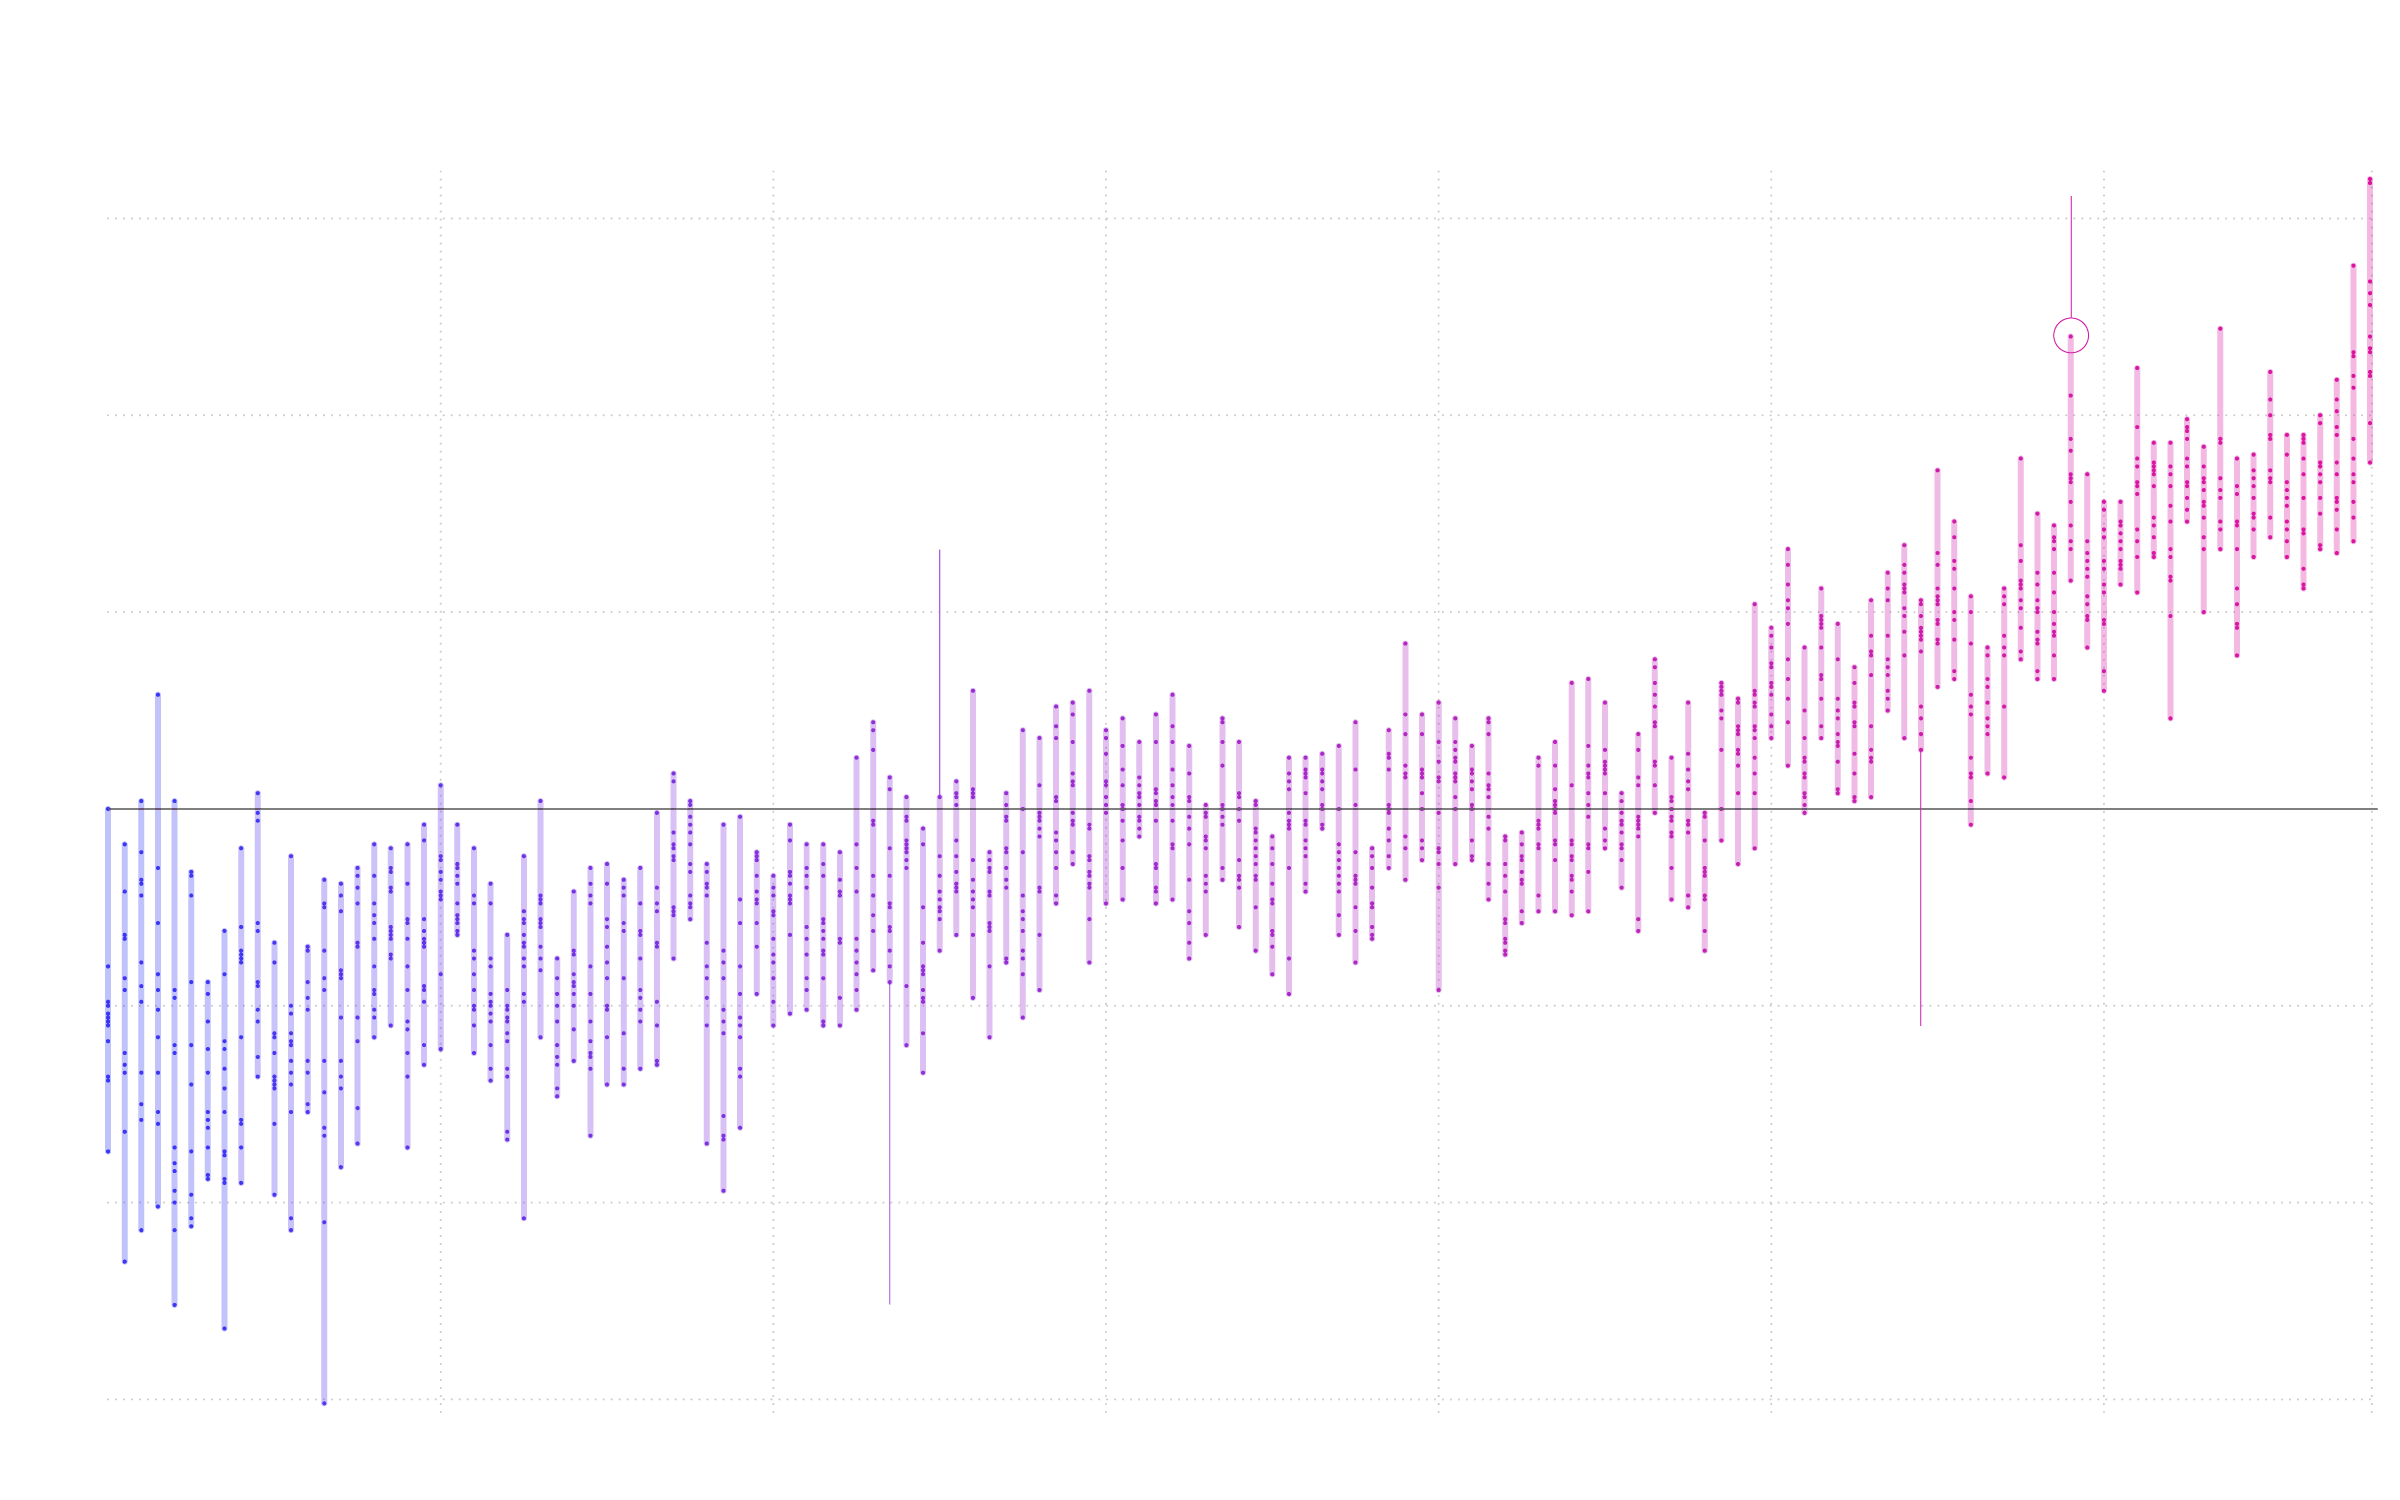
Surface Temperature Anomalies
estimate of global surface temperature change
Land-Surface Air Temperature Anomalies
FEBRUARY 1998 — Super El Niño
It made this year exceptionally warm and not clearly exceeded until 2014
1.5˚C
1˚C
1930 — Human population
It reached two billion
0.5˚C
0˚C
1989 — Carbon emissions
Carbon emissions from fossil fuel burning and industry reached six billion tonnes per year
-0.5˚C
-1˚C
1927 — Carbon emissions
Carbon emissions from fossil fuel burning and industry reached one billion tonnes per year
-1.5˚C
1880
1900
1920
1940
1960
1980
2000
2016
year
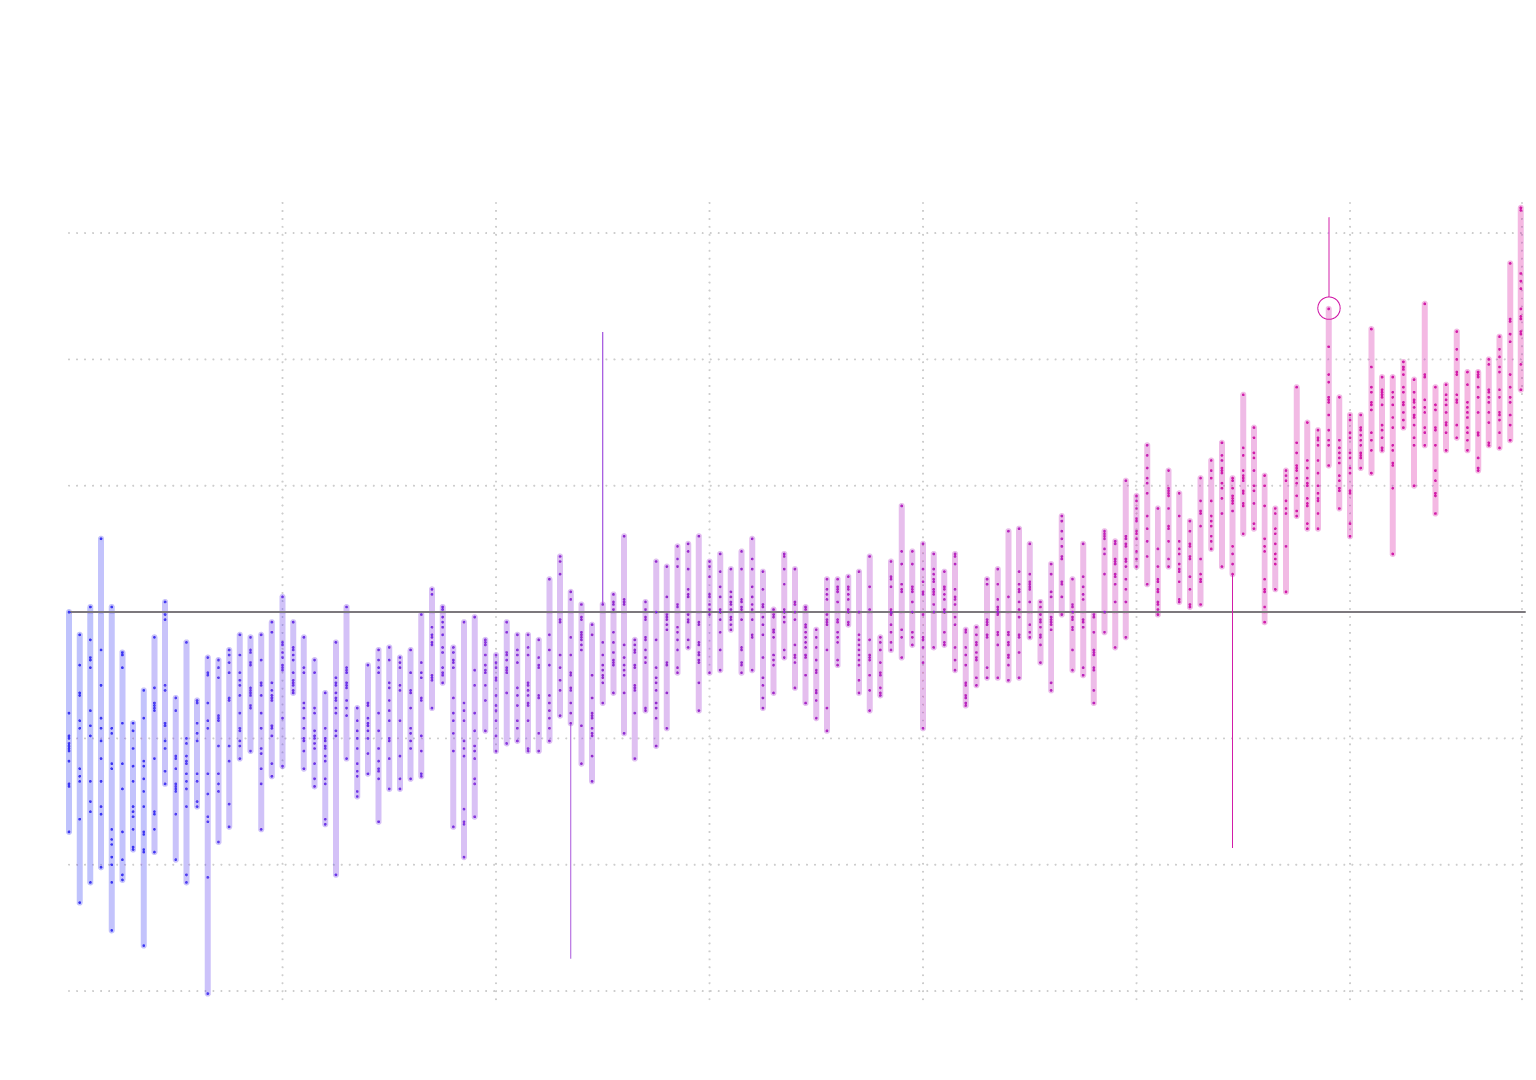
Surface Temperature Anomalies
estimate of global surface temperature change
Land-Surface Air Temperature Anomalies
FEBRUARY 1998 — Super El Niño
It made this year exceptionally warm and not clearly exceeded until 2014
1.5˚C
1930 — Human population
It reached two billion
1˚C
0.5˚C
0˚C
1989 — Carbon emissions
Carbon emissions from fossil fuel burning and industry reached six billion tonnes per year
-0.5˚C
-1˚C
1927 — Carbon emissions
Carbon emissions from fossil fuel burning and industry reached one billion tonnes per year
-1.5˚C
1880
1900
1920
1940
1960
1980
2000
2016
year
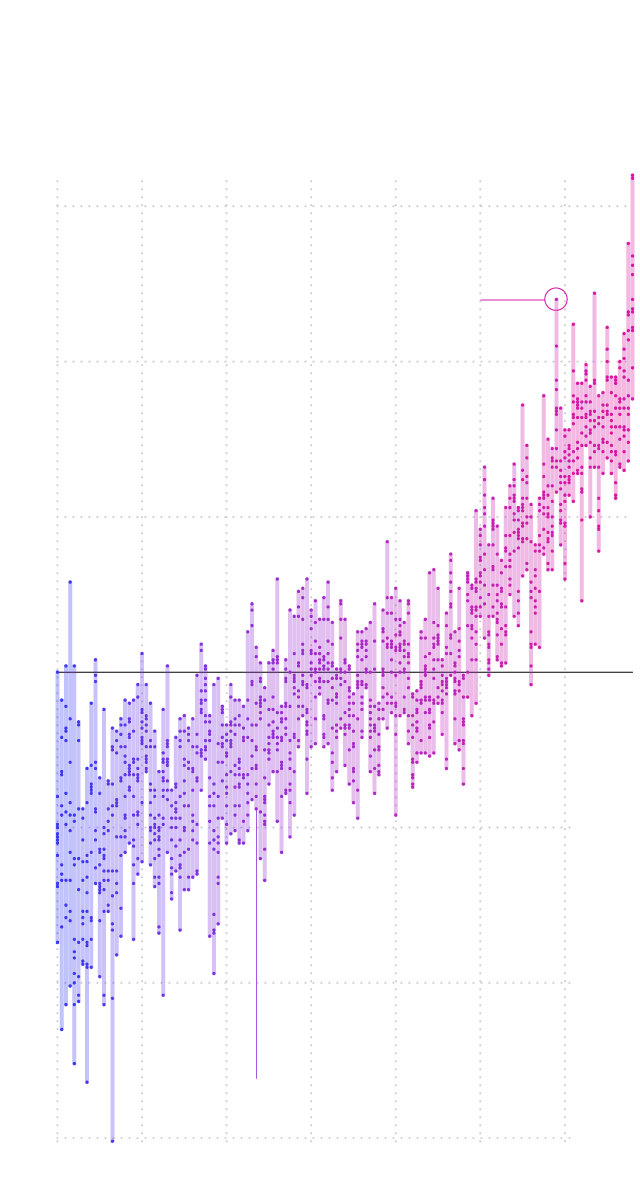
Surface Temperature Anomalies
estimate of global surface temperature change
Land-Surface Air Temperature Anomalies
1.5°C
FEBRUARY 1998 — Super El Niño
It made this year exceptionally warm and not clearly exceeded until 2014
1°C
0.5°C
0°C
-0.5°C
1927 — Carbon emissions
Carbon emissions from
fossil fuel burning and
industry reached one billion tonnes per year
-1°C
-1.5°C
1880
1900
1920
1940
1960
1980
2000