Showcase
RAWGraphs repositories and documentation
April 14th, 2021, by RAW Graphs Team

Last week we released the full codebase of RAWGraphs to the public, so we’d like to briefly introduce it to you.
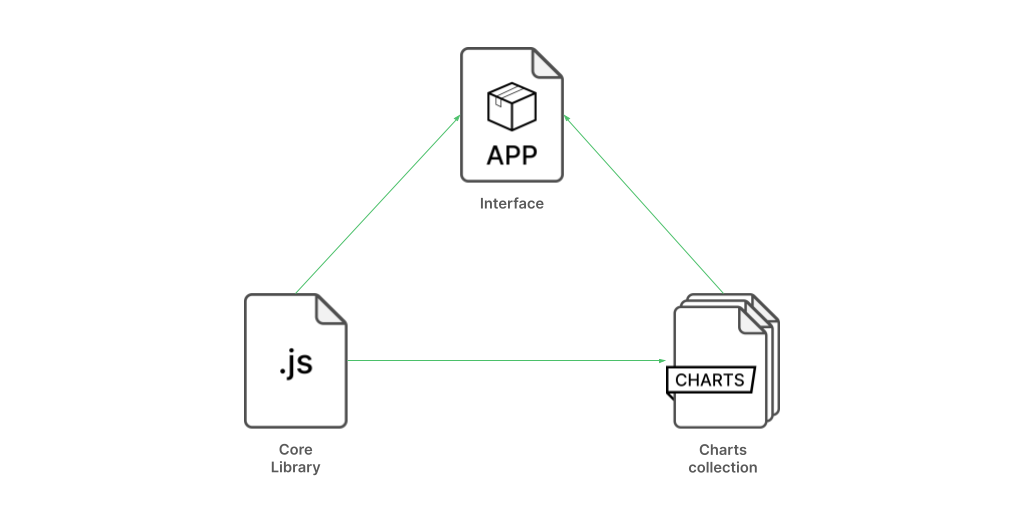
The project is composed of three main parts: rawgraphs-core, rawgraphs-app, rawgraphs-charts. Each one has its own repository, and you can clone, modify it and host your own version of them.
Let’s quickly see what they contain and how they can be useful for you.
RAWGraphs-core
As the name says, it’s the core library of the project. You can use it to define new charts, or to render them on a web page. It adopts the latest Javascript standards, and even if it is mainly conceived to be used through the RAWGraphs interface, you can nonetheless use it directly in your code. This means that you can import it in any web project and use it to define and render your custom chart - or, use it to render a pre-build chart like to ones in our rawgraphs-charts repository.
You can find the documentation at this link: https://rawgraphs.io/rawgraphs-core/docs/
RAWGraphs-app
This repository contains all the code needed to build the RAWGraphs interface. It actually provides the GUI to rawgraphs-core library and to the charts defined with it.
This repository contains both the rawgraph-core and the charts (see next section), so you can clone it if you want to use it locally or install it on your own servers. You can also choose which charts you want to import: therefore if you developed your own charts, you can provide them through a modified version of rawgraphs-app.
RAWGraphs-charts
This repository contains a selection of charts we developed using rawgraphs-core library. At the moment it contains the 27 charts that are provided through the publicly hosted version of RAWGraphs: https://app.rawgraphs.io/
You can use this repository to create your own custom version of rawgraphs-app or as an example to develop your own charts.
If you want to know more on how it’ structured, you can find here the documentation: http://rawgraphs.io/rawgraphs-charts/
Contributing to the project
Being a free, open-source project contributions are welcome! Check out our contributing guidelines: https://github.com/rawgraphs/rawgraphs-app/blob/master/CONTRIBUTING.md
You can help us in closing open issues, fix bugs and vulnerabilities you spotted, or adding the functionalities identified in the roadmap. Have a look to the open issues in the three repositories and find out on what you’d like to contribute: https://github.com/rawgraphs/rawgraphs-app/issues https://github.com/rawgraphs/rawgraphs-core/issues https://github.com/rawgraphs/rawgraphs-charts/issues
Contribute with sponsorships
If you are not able to code but you still want to contribute you can help us by providing financial support to buy some development time or finance specific features. Feel free to contact us if you’re interested in supporting the project.
