Learning>Rawgraphs 1.0
How to make a bump chart (RAWGraphs 1.0)
3 min.bump charttime series
In this guide you’ll learn how to create a bump chart to see how the composition of foreign residents in Milan has changed over time.
Bump charts are useful to see the amount of different categories over time and their ranking. They are similar to area graphs or to stream graphs, the difference is that areas are sorted according their ranking.
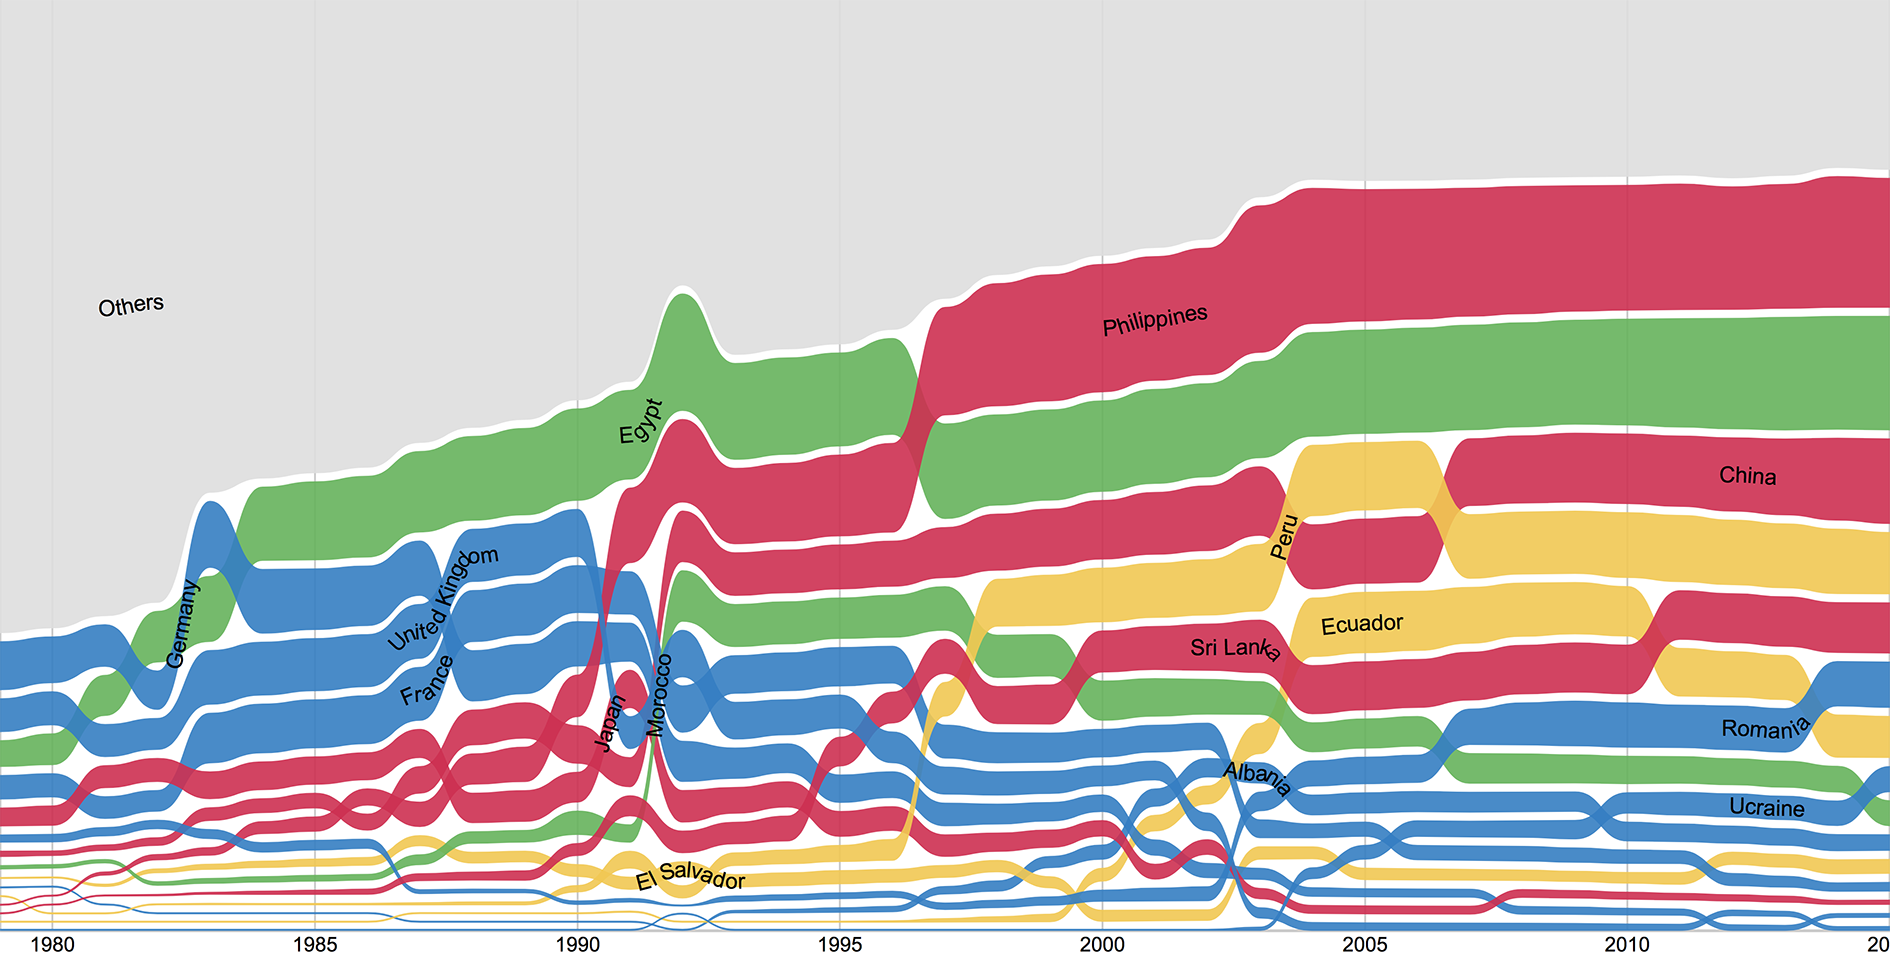
GOAL OF THE TUTORIAL: create a bump chart representing the main nationalities of foreign residents in Milan. Each area is a nationality, colors will represent continents.
01. Load your data
The first step is to copy and paste your data into RAWGraphs.
For this example we will use a dataset on foreign residents in Milan from 1979 to 2015, provided in open data by the municipality of Milan. The data must contain three columns: the first one containing categories (in our case, Country), the second one containing dates (in our case, Date) and a third one containing values (in our case Residents).
Dates must be formatted in a specific way if you want to use them in RAWGraphs: check here the accepted formats.
Here you can see the dataset we are going to use:
You can also download it through the link on the left. In few second you should see the green bar saying “592 records in your data have been successfully parsed!”
02. Choose the bump chart layout
After pasting your data, scroll down and select the “bump chart” visual model.

03. Map your dimensions
The bump chart layout has three visual variables.
| VARIABLE | TYPE | REQUIRED | MULTIPLE | DESCRIPTION |
| Group | String, numbers | [fa class=”fa-asterisk”] |
For each unique value found in the column, a group (a new area) is created. | |
| Date | Dates, number | [fa class=”fa-asterisk”] |
Depiction of time along the horizontal axis. RAWGraphs requires dates in a specific format: check here how. | |
| Size | Number | [fa class=”fa-asterisk”] |
Size of the area for each date in the dataset. |
It’s time to map your data and create the visualization. On the left you have the list of dimensions in your dataset, on the right the available visual variable of the bar chart layout.
Drag and drop the dimensions as following:

In this way we created an area for each value found in the Country column, set the size according to the value found in the column Residents for each corresponding Date.
04. Refine and export
To reach the final results we can customize the visualization with some parameters you can find next to the visualization.
For the bump chart the options available are the following:
| OPTION | DESCRIPTION |
| Width | artboard width in pixels |
| Height | artboard height in pixels |
| Padding | Vertical distance among areas, in pixel |
| Normalize | Values are normalized by the sum of all values belonging to the same date. |
| Interpolation | How curves are drawn. “Basis spline” means that the algorithm will try to smooth peaks. “Sankey” means that peaks are kept, and the curve is smoothed among dates. “Linear” means that a straight line will connect the values. |
| Sort by | Sorting of areas: can be by the size value (ascending or descending) or by group name. |
| Show labels | If selected, groups names are shown in the chart. |
| Show grid | If selected, a timeline is shown on the background. |
| Colour scale | list of uniques values in the dimension mapped as “color”. If set to ordinal, you can set a color for each value. If set to linear, the app will try to find the minimum and maximum value contained in the dimension, and then creating a gradient among those two values. |
For the final results we have set the options as following:
- Width to 940 pixels;
- Height to 483 pixels;
- Padding to 1 pixel;
- Select “normalize”;
- Select “Sankey” interpolation;
- Sort by descending values;
- Show labels and grid;
- Set colors as following (Albania to #0080c7, China to #e10050, Ecuador to #f9c734, Egypt to #44b750, El Salvador to #f9c734, France to #0080c7, Germany to #0080c7, Japan to #e10050, Morocco to #44b750, Others to #dedede, Peru to #f9c734, Philippines to #e10050, Romania to #0080c7, Sri Lanka to #e10050, Ucraine to #0080c7, United Kingdom to #0080c7).
Here is the finished chart. You can export it in svg or png using the download function at the bottom of the page.

How to cite this guide
"How to make a bump chart (RAWGraphs 1.0)", by RAWGraphs Team. Licensed under CC BY-NC-SA 4.0. Accessed: November 08, 2021, from undefined
Copy to clipboard
RAW
A project by

