Gallery
A place to showcase the best examples of RAWGraphs in use

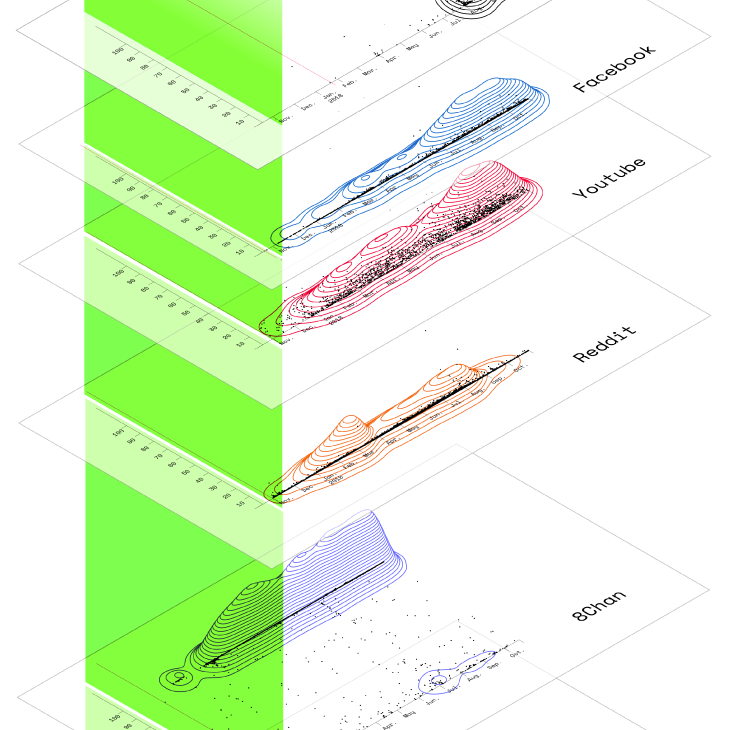
Understanding Normiefication: A Cross-Platform Analysis of QAnon
submitted by
description
Visualizations part of the research that explores the different ways of normiefication in an empirical way, taking as a case study the right-wing extremist QAnon conspiracy theory. The project was done by a group of researchers during the DMI Winter School 2019.
charts used
Area Graph, Contour Plot
