Gallery
A place to showcase the best examples of RAWGraphs in use

Skills Background
submitted by
description
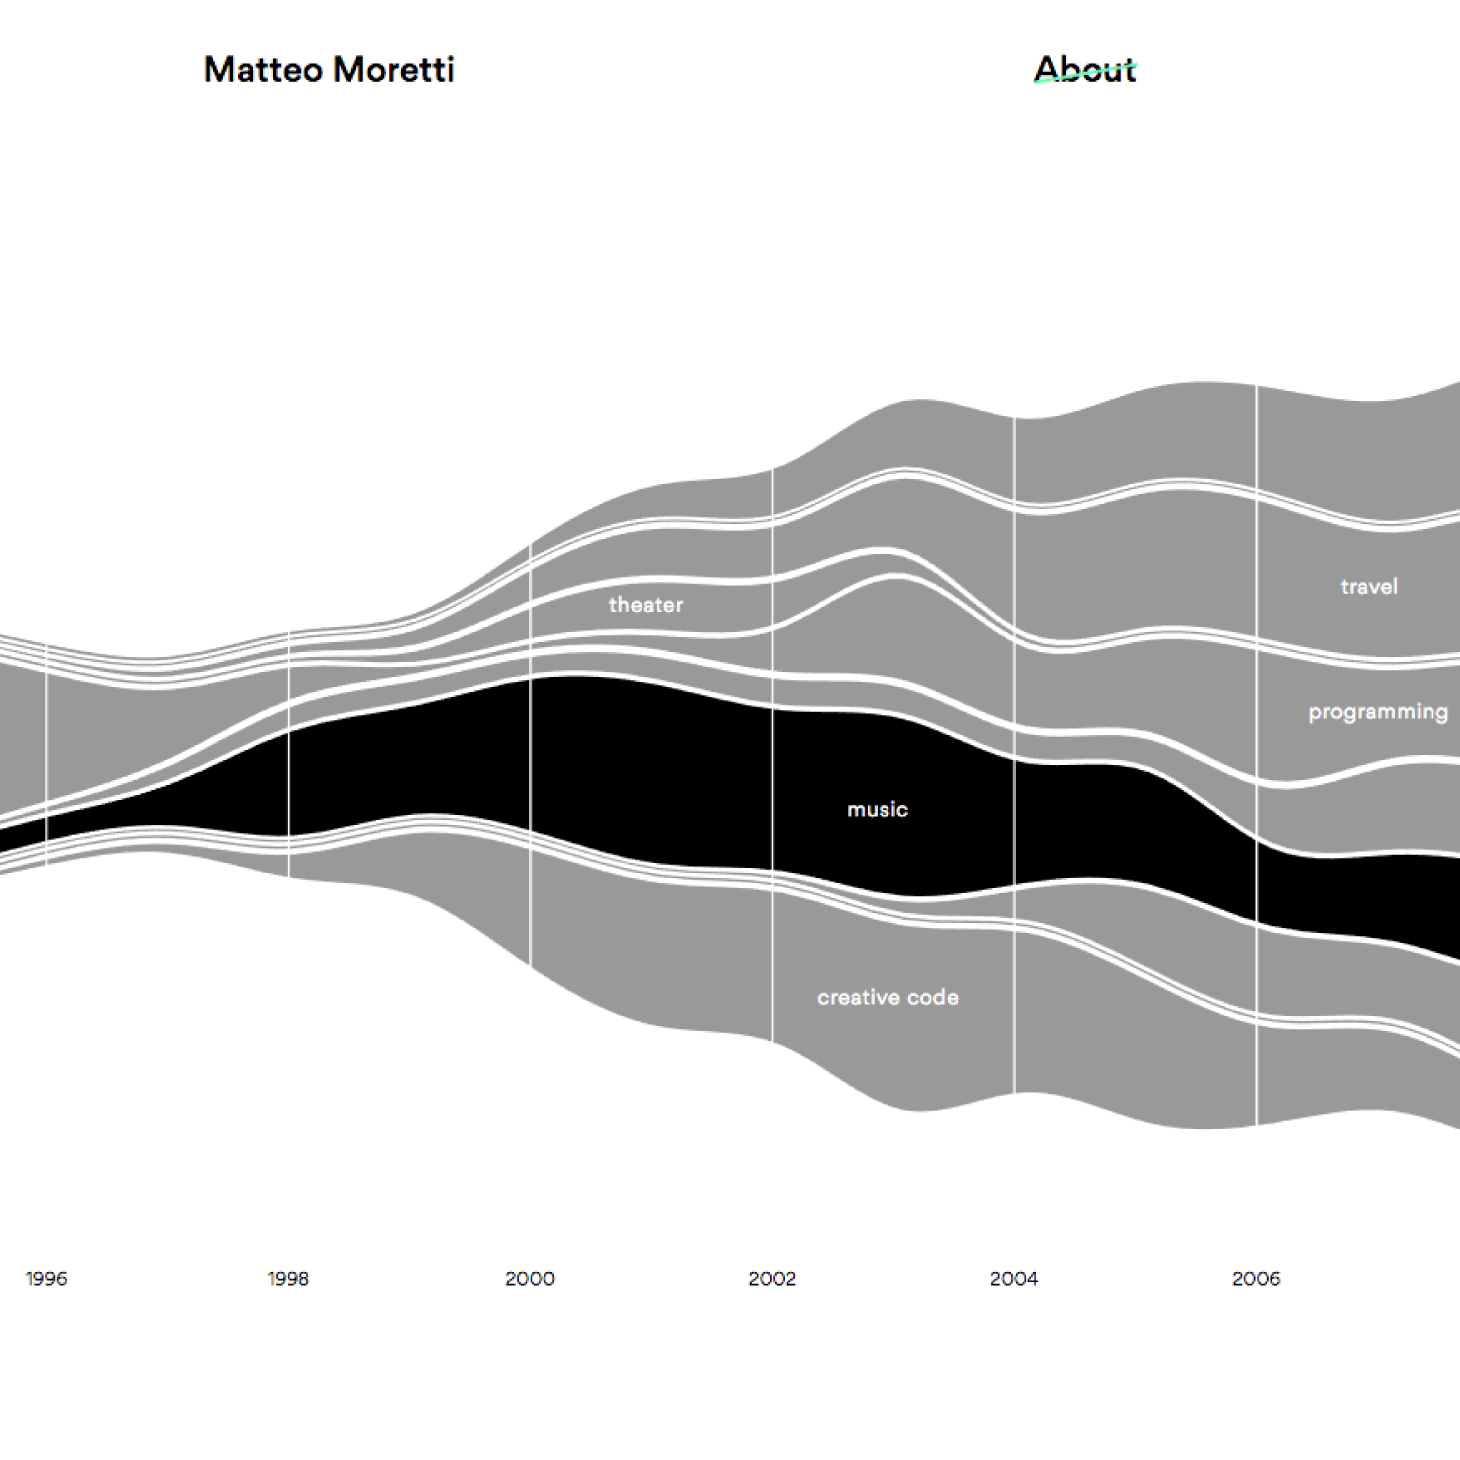
The streamgraph allows, in few time and space, to visually communicate 20 years of works and skills evolution. I like its organic shape that better fits the purpose of the visualisation, evoking the evolution of a creative flow, too. Then I added a little bit of interactivity with jQuery, in order to transform its exploration in a mini engaging experience.
charts used
Bump Chart, Streamgraph
