Gallery
A place to showcase the best examples of RAWGraphs in use

Moving out of poverty on The Outpost
submitted by
description
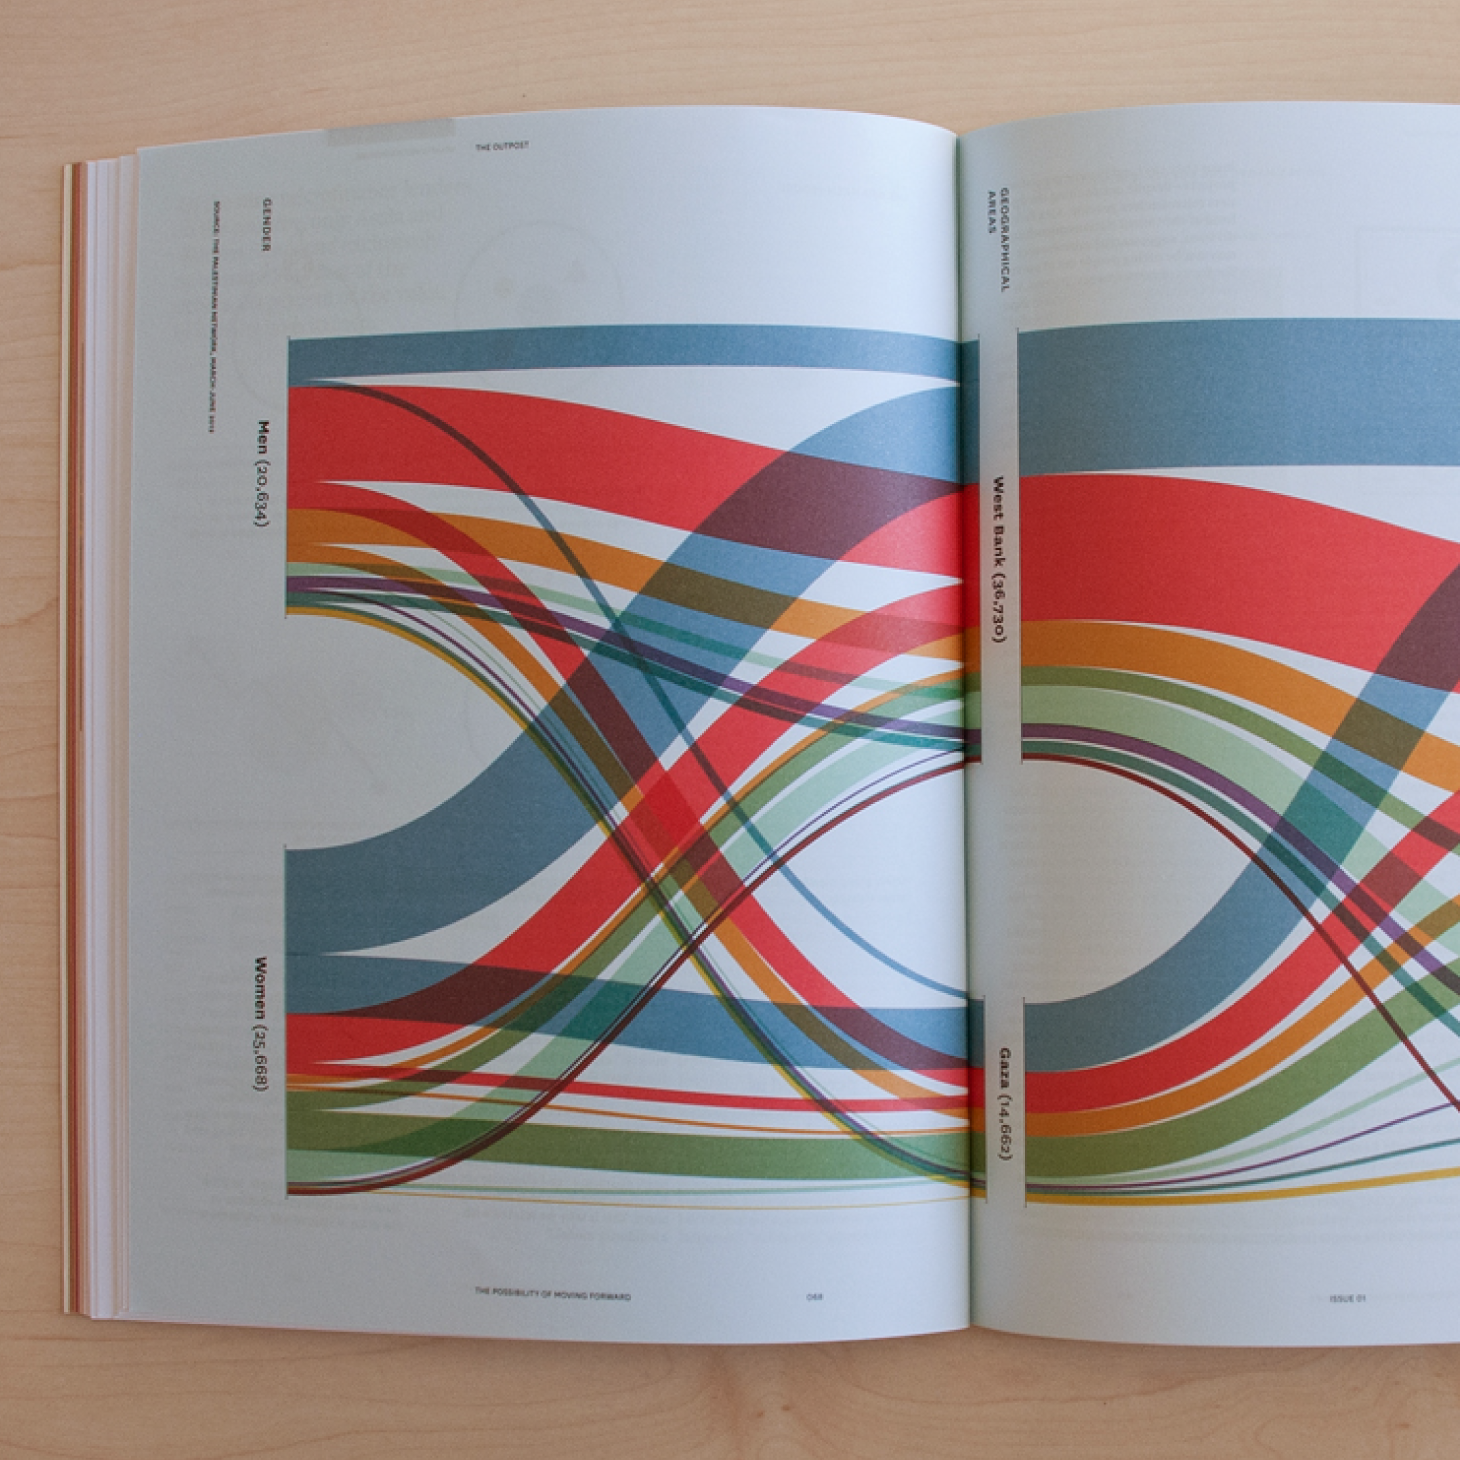
The visualization shows the number of clients that each microfinancing institution has distributed by geographical area in Palestine and gender of the client. Published on The Outpost, a magazine of possibilities in the Arab world.
charts used
Alluvial Diagram
