Gallery
A place to showcase the best examples of RAWGraphs in use

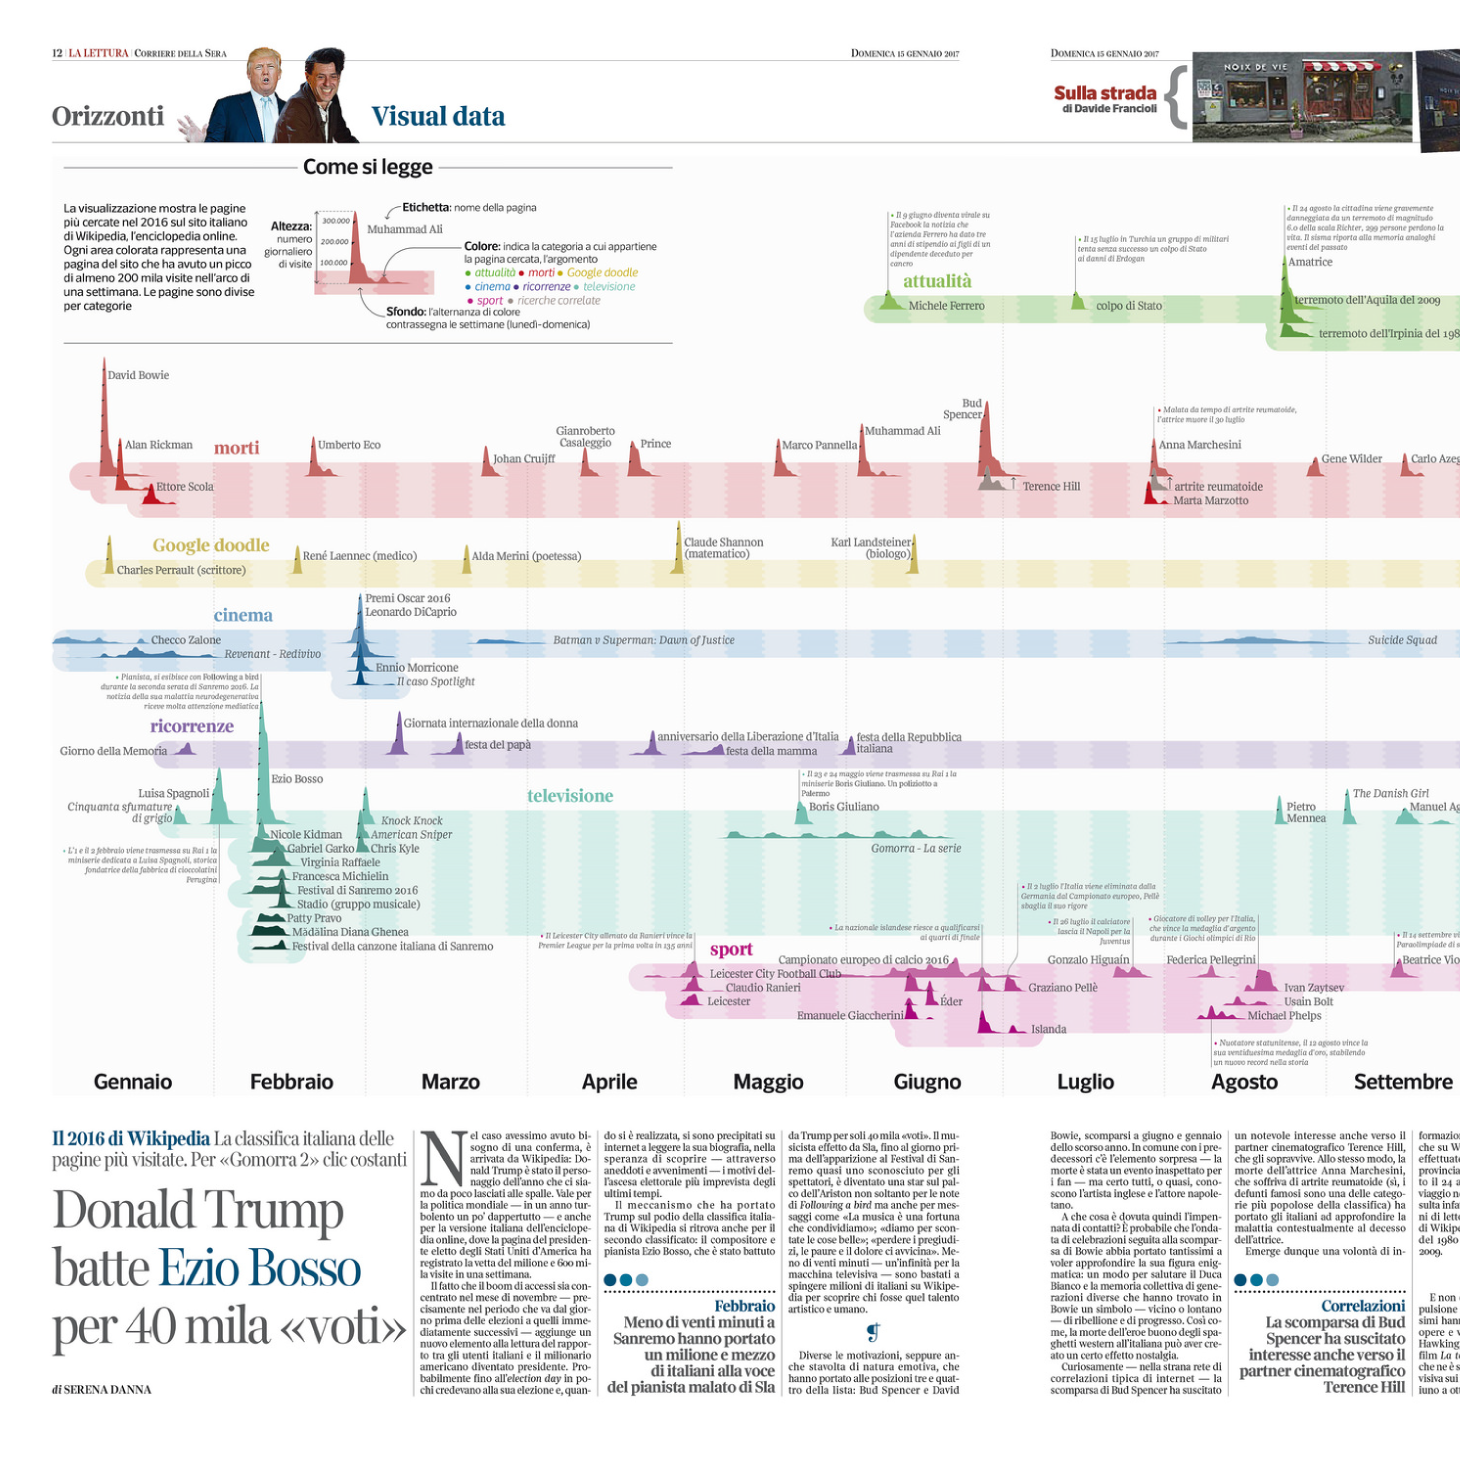
Most visited articles on italian Wikipedia in 2016
submitted by
description
Visualization of all the wikipedia articles that generated a peak of 200,000 views during a week. each page is visualized as an area graph, height is proportional to the daily pageviews. Published on La Lettura.
charts used
Area Graph
