Gallery
A place to showcase the best examples of RAWGraphs in use

Makeover Monday data visualizations
submitted by
description
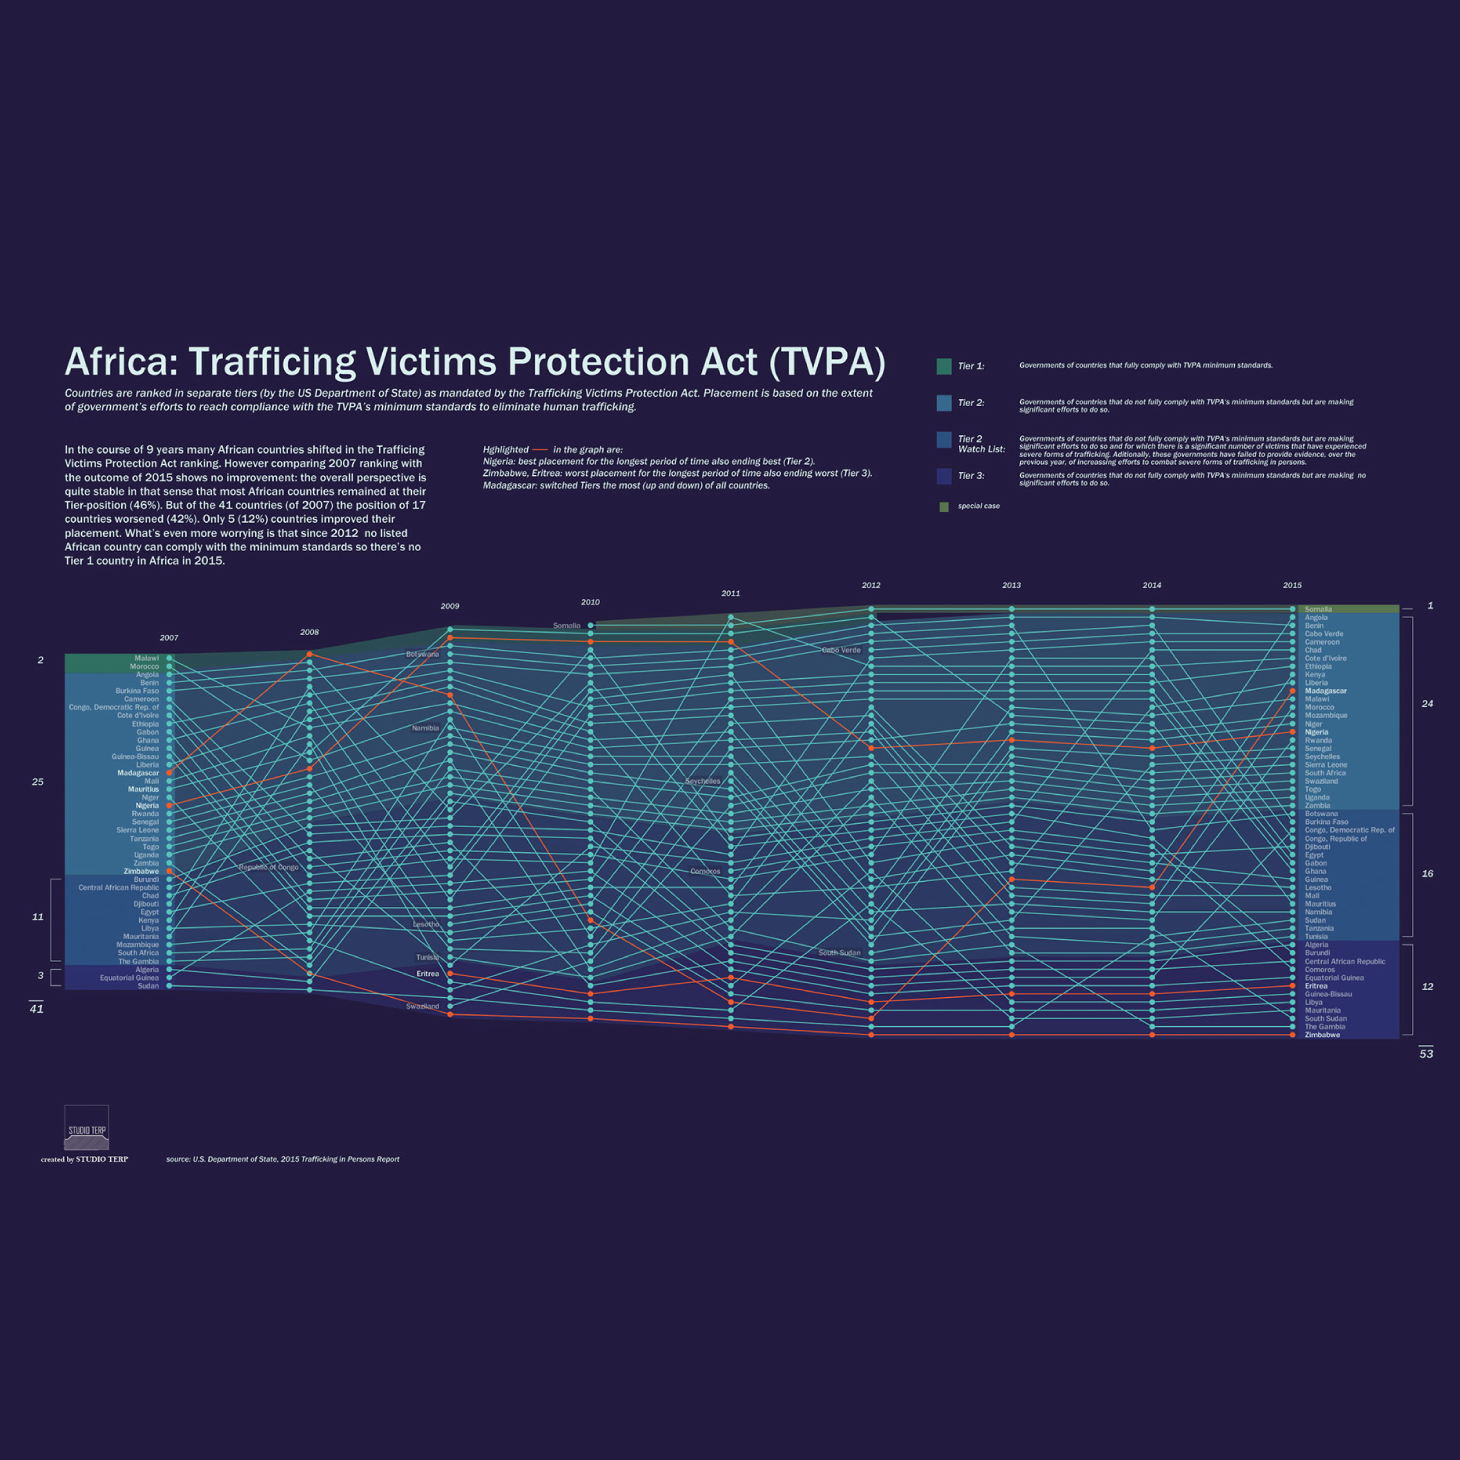
Several MakeoverMonday contributions in which I set my own goal: to trigger myself into new/other graphical styles and/or forms. (The data itself is mostly a small part of a bigger story and I didn’t check up on all the background-info, sometimes even the statistics are questionable. Do consider these visualizations purely as an exercise)
charts used
Alluvial Diagram, Parallel Coordinates, Scatterplot
