Gallery
A place to showcase the best examples of RAWGraphs in use

DataVizSociety Slack’s Activity
submitted by
description
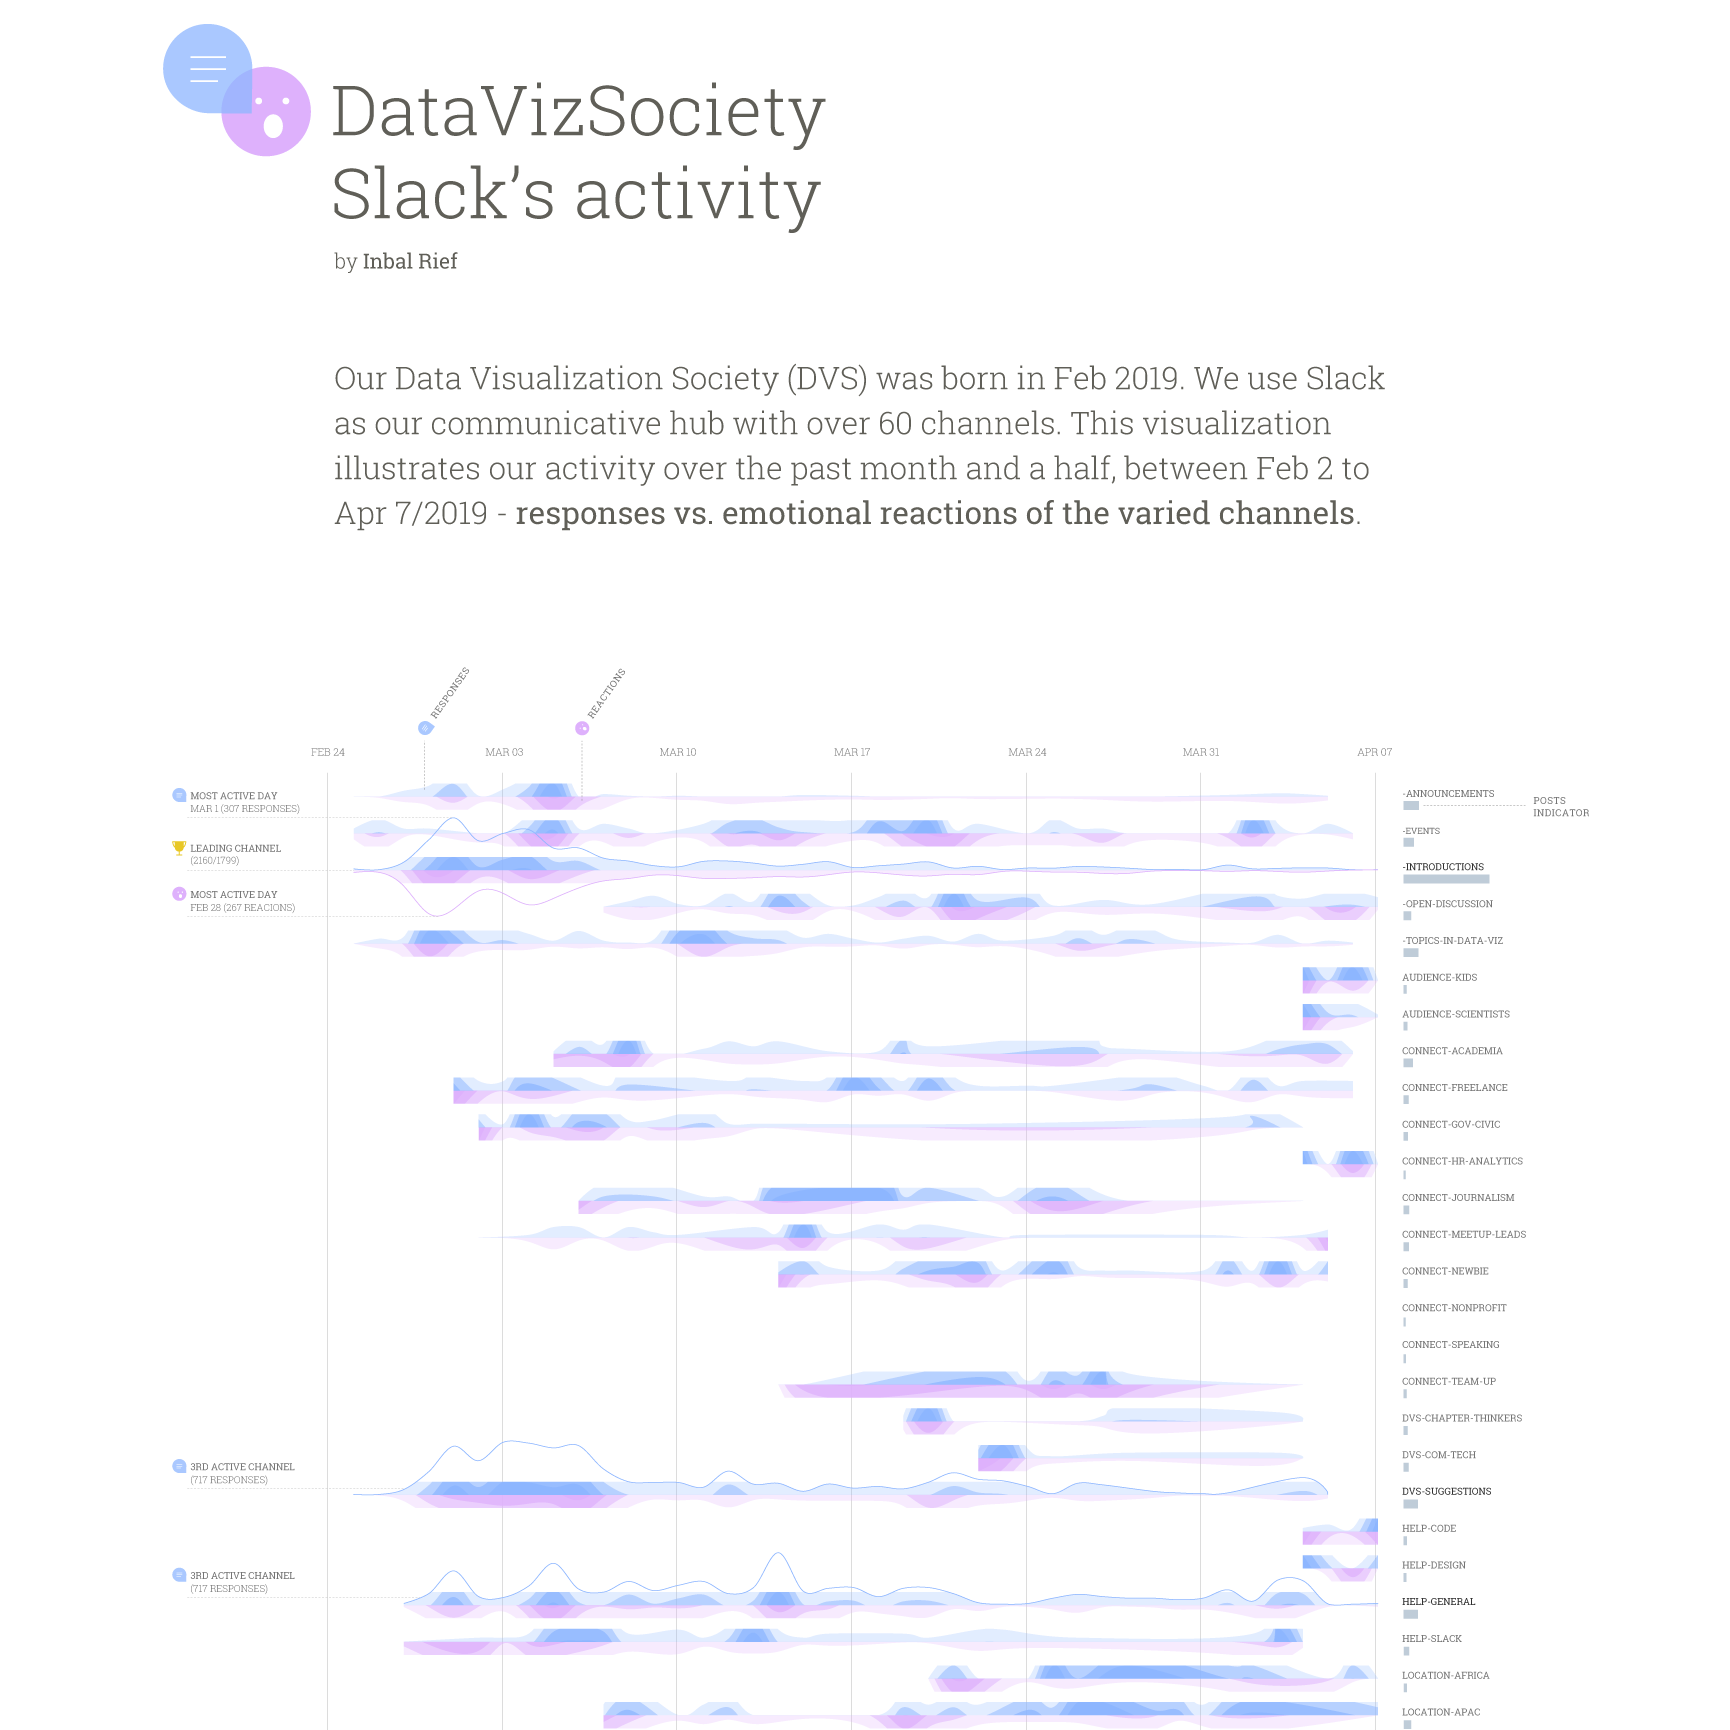
The Data Visualization Society (DVS) was born in Feb 2019. We use Slack as our communicative hub with over 60 channels. This visualization illustrates our activity over the past month and a half, between Feb 2 to Apr 7/2019 – responses vs. emotional reactions of the varied channels.
charts used
Horizon Graph
