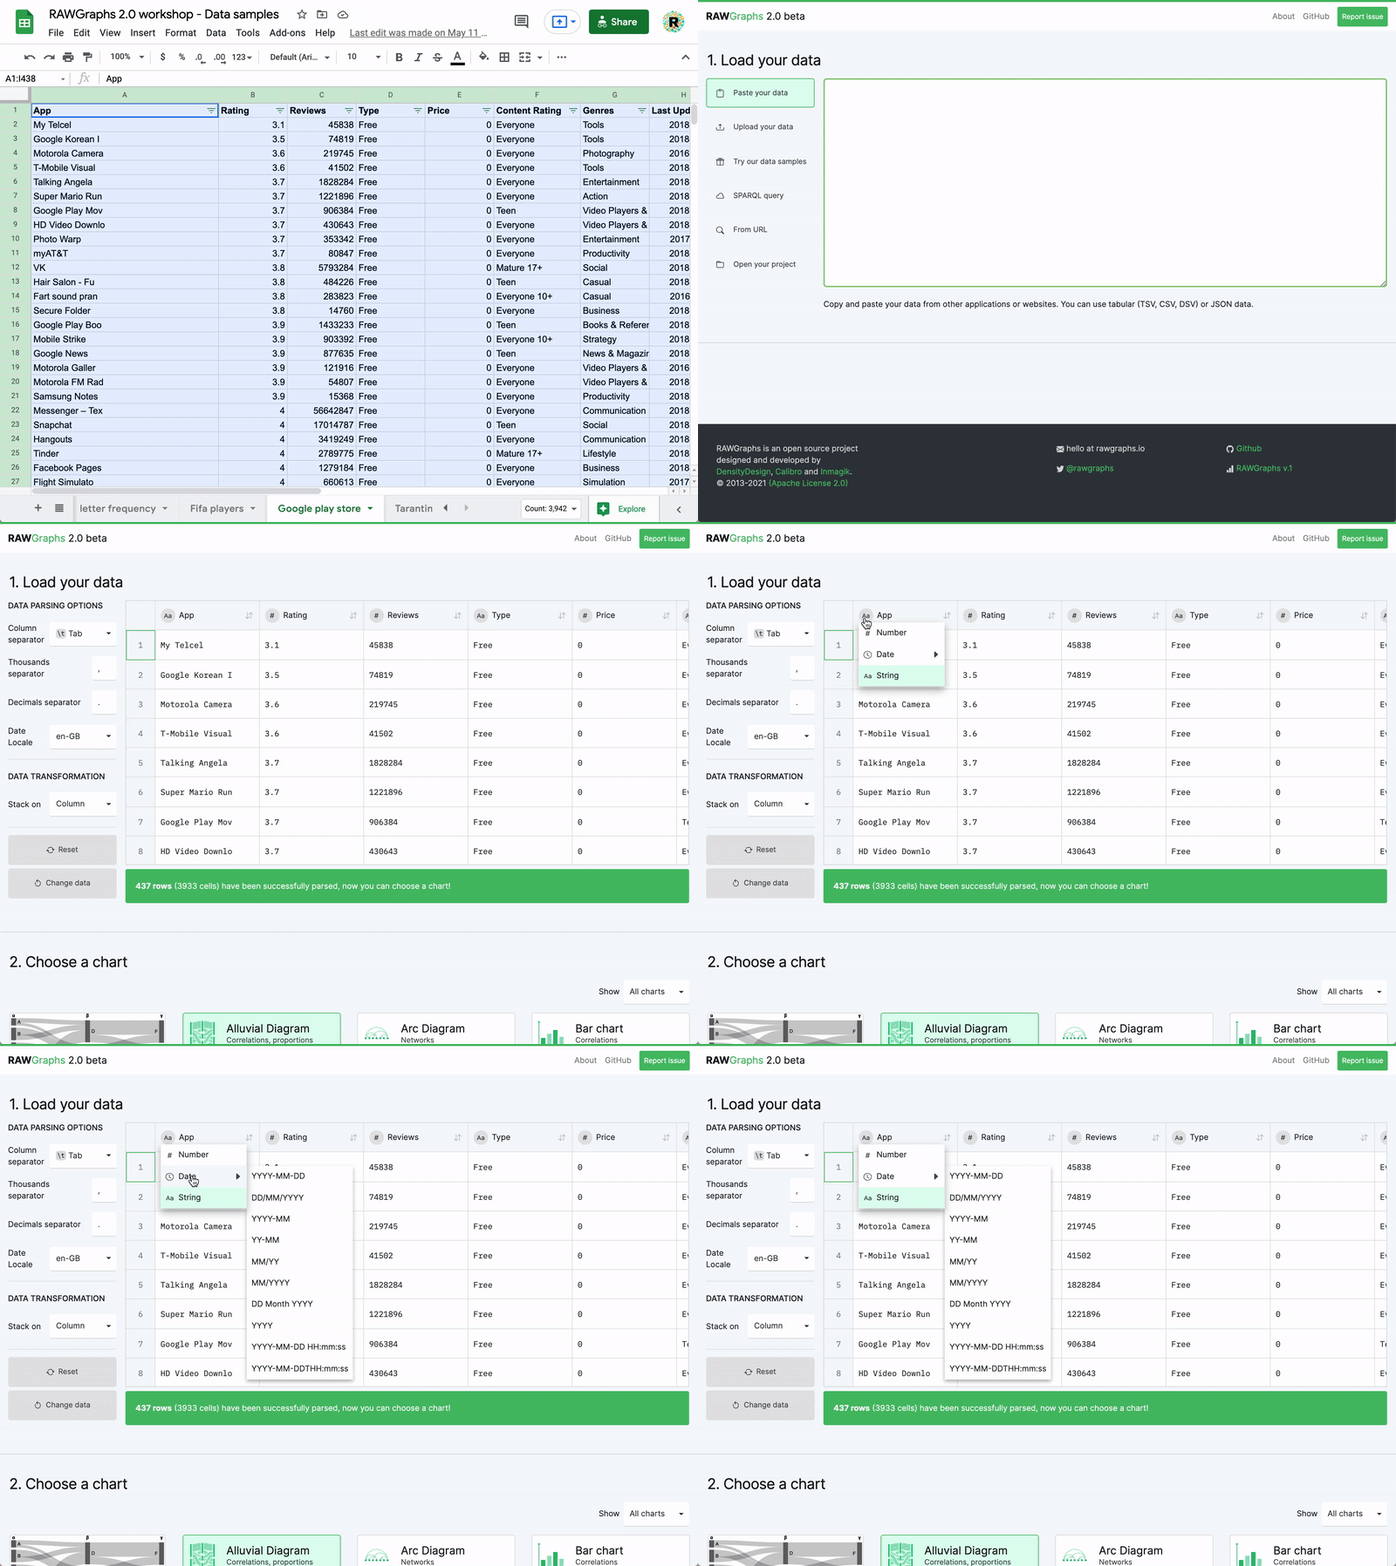
1First, insert your data into RAWGraphs
As simple as a copy-paste.
RAWGraphs works with delimiter-separated values (i.e. csv and tsv files) as well as with copied-and-pasted texts from other applications (e.g. Microsoft Excel, Google Spreadsheets, TextEdit, …). It also works with CORS-enabled endpoints (APIs).
No worries, your data is safe.
Even though RAWGraphs is a web app, the data you insert will be processed only by the web browser. No server-side operations or storages are performed, no one will see, touch or copy your data!
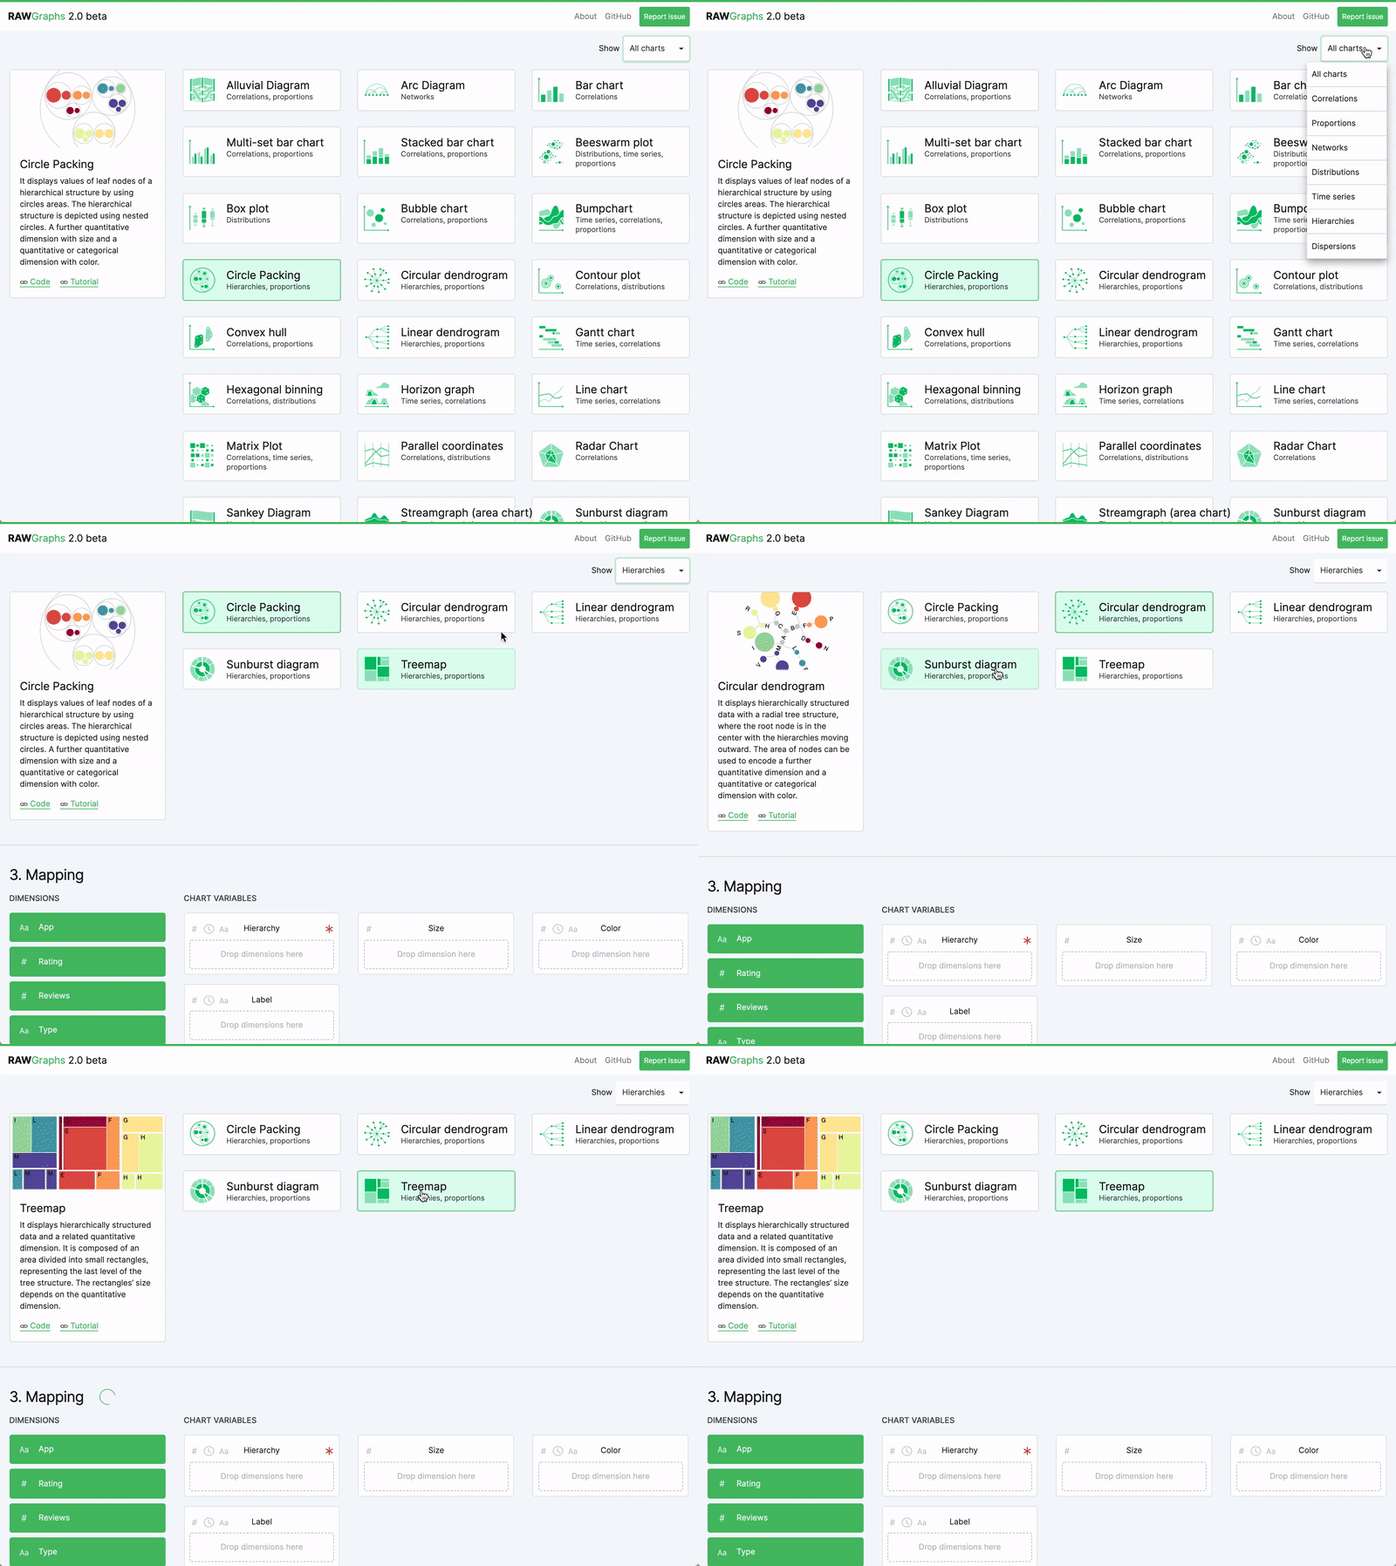
2Choose within a wide range of visual models
Conventional and unconventional layouts.
We designed and developed RAWGraphs with designers and vis geeks in mind. That’s why we focused on providing charts that are not easy to produce with other tools. But don’t worry, you can also find bar charts and pies! Something missing? See how easy is to build your own model.
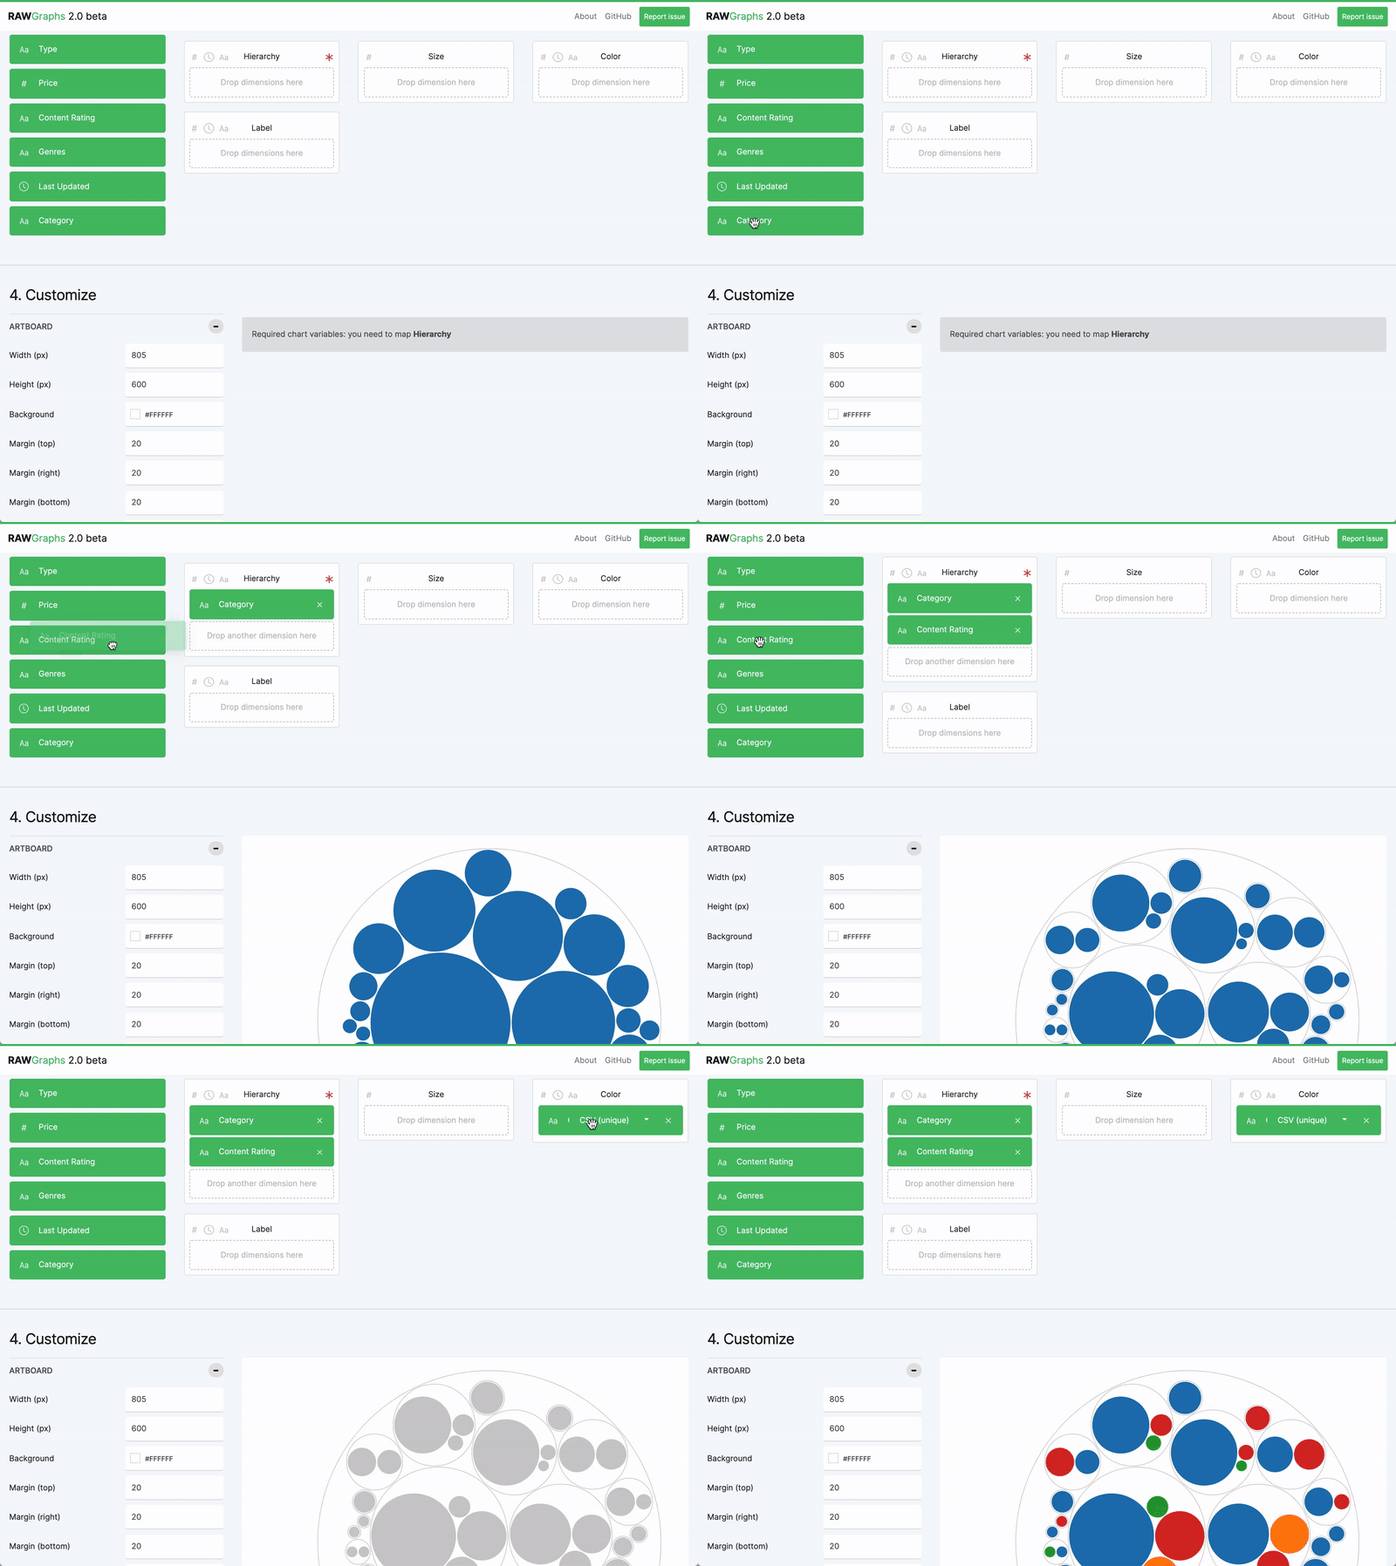
3Tune your chart and explore your data
Understand and map visually your data dimensions.
Do you want to know more about your data? Do you want to explore patterns and trends? Just map the dimensions of your dataset with the visual variables of the selected layout.
Visual feedback, immediately.
As soon as the dataset dimensions are mapped you’ll see the visualization appear. Not happy with the result? Try another type of mapping to have a new visualization in the blink of an eye.
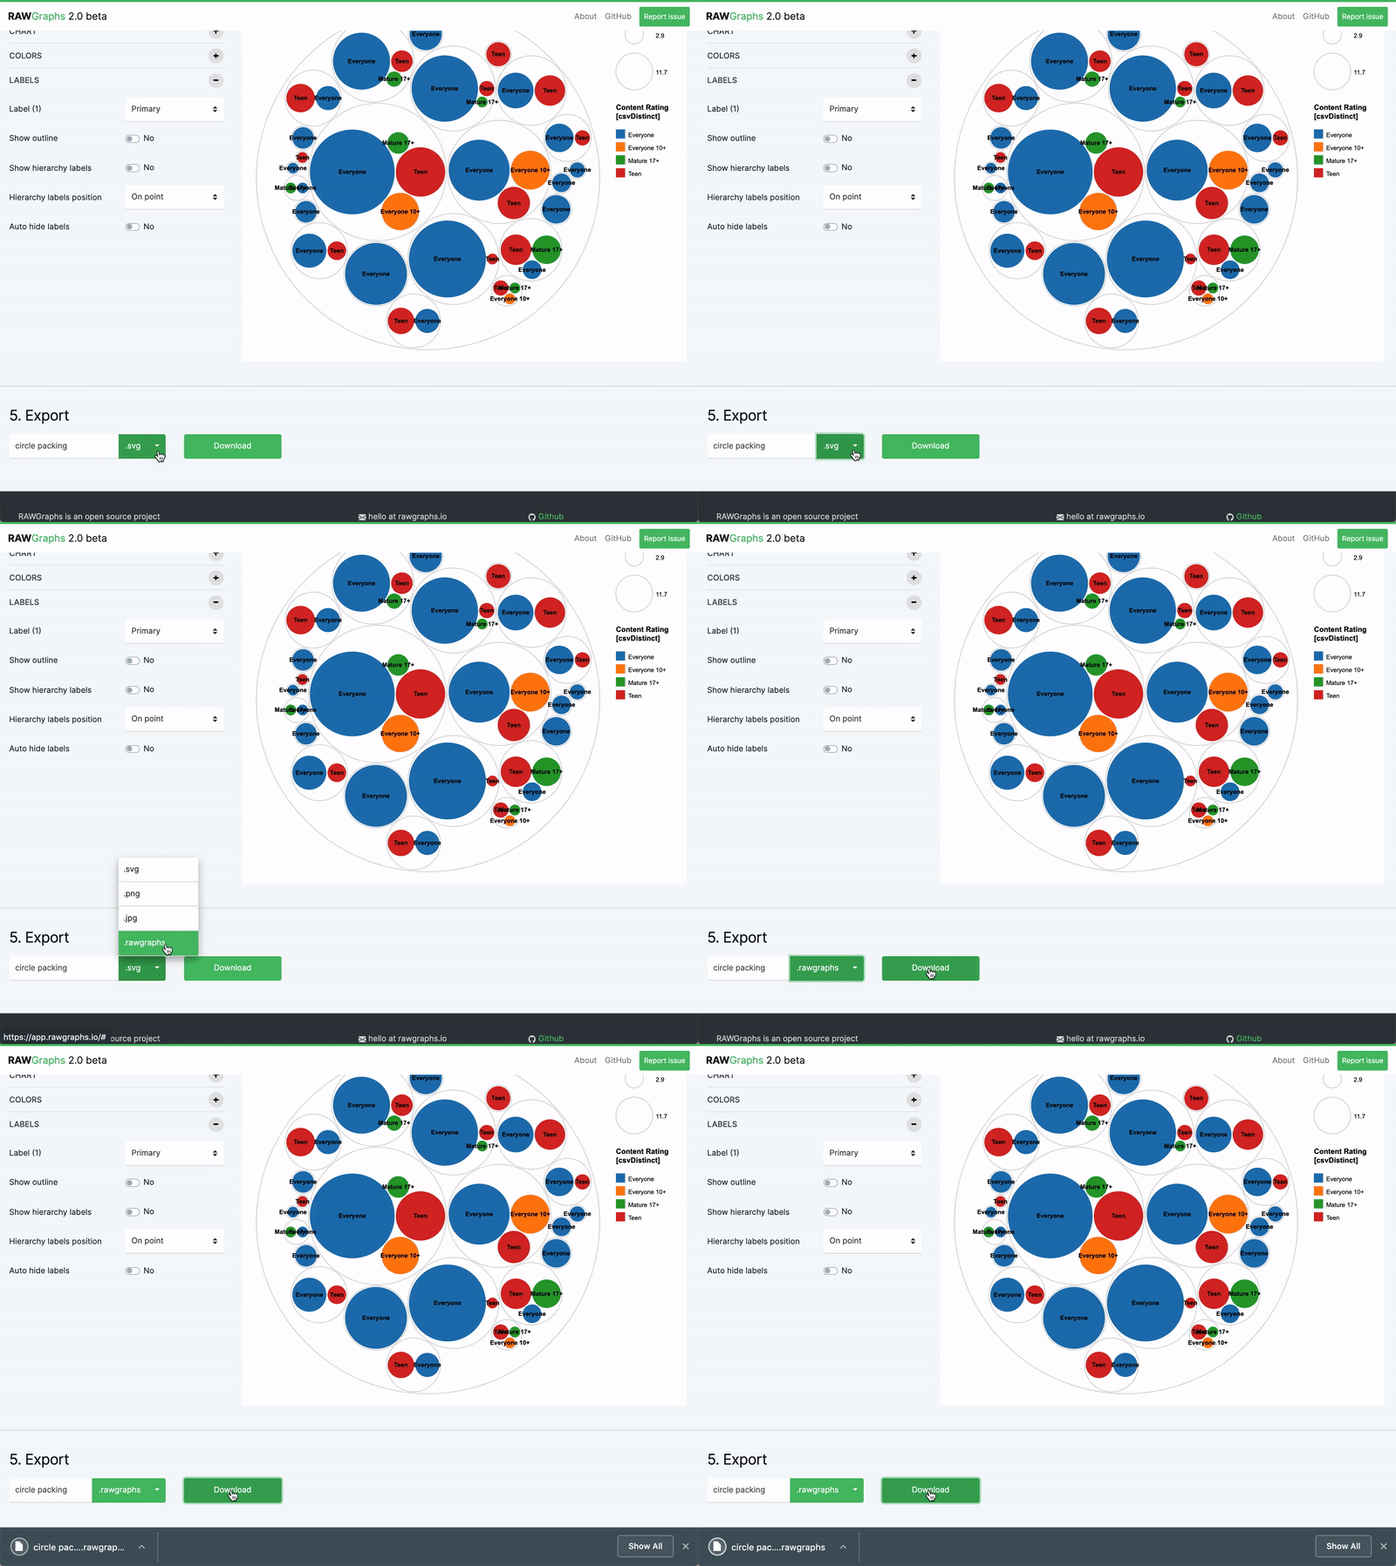
4Export and go anywhere
Semifinished vectors and data structures.
RAWGraphs allows you to export visualizations as vector (SVG) or raster (PNG) images and embed them into your web page. Since RAWGraphs produces semifinished visualizations, you can even open them in your favorite vector graphics editor and improve them.


